
Videos
Predicting Land Value Both
a. Which do you think has a stronger relationship with value of the land—the number of acres of land or the number of rooms in the homes? Why?
b. If you were Dying to predict the value of a parcel of land (on which there is a home) in this area, would you be able to make a better pre-diction by knowing the acreage or the number of rooms in the house? Explain.
a.
Determine which one has stronger relationship with the value of land, the number of acres of land or the number of rooms.
Answer to Problem 1SE
The number of acres of land has a stronger relationship with the value of land.
Explanation of Solution
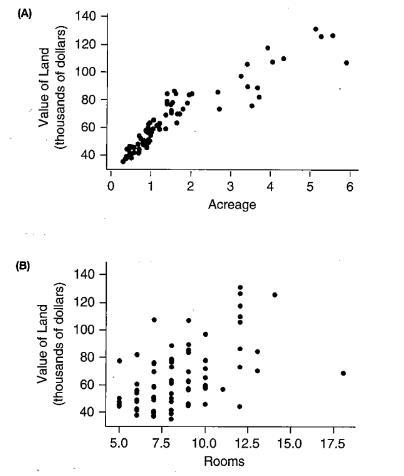
Scatterplot A shows the relationship between the value of land and number of acres of land that is provided. Scatterplot B shows the relationship between the value of land and number of rooms in the house that is given.
A scatterplot has less scattered data points and are forming a linear trend. Therefore, it can be said that there is a strong relationship between these two variables, number of acres of land and value of land.
The data points in the scatterplot output for B has more scattered data points and without forming any specific pattern and trend. It can be said that there isn’t a strong relationship between these two variables.
b.
Determine whether it is a good approach to make predictions for the value of a parcel of land by knowing the acreage or the number of rooms in the home.
Answer to Problem 1SE
Better prediction can be made by knowing the value of the acreage.
Explanation of Solution
Scatterplot A shows that the value of land has a stronger relationship with the acreage than the number of rooms in the house because there is less variability in the vertical direction. Changes made in the number of acres will affect the value of land more as compared to the number of rooms in the house.
Hence, the better prediction can be made by knowing the value of the acreage.
Want to see more full solutions like this?
Chapter 4 Solutions
Introductory Statistics (2nd Edition)


- Draw a scatter plot for the data in Table 3. If we wanted to know when the population would reach 15,000,would the answer involve interpolation or extrapolation?arrow_forwardMathematical Models In Exercises 9 and 10, (a) plot the actual data and the model of the same graph and (b) describe how closely the model represents the data. If the model does not closely represent the data, suggest another type of model that may be a better fit. The ordered pairs below give the civilian non-institutional U.S. populations y (in millions of people) 16 years of age and over not in the civilian labor force from 2006 through 2014. 2006,77.42011,86.02007,78.72012,88.32008,79.52013,90.32009,81.72014,92.02010,83.9 A model for the data is y=1.92t+65.0,6t14, where t represents the years, with t=6 corresponding to 2006.arrow_forwardMathematical Models In Exercises 9 and 10, (a) plot the actual data and the model of the same graph and (b) describe how closely the model represents the data. If the model does not closely represent the data, suggest another type of model that may be a better fit. The ordered pairs below give the revenues y (in billions of dollars) for Activision Blizzard, Inc., from 2008 through 2014. 2008,3.032012,4.862009,4.282013,4.582010,4.452014,4.412011,4.76 A model for the data is y=0.184t+2.32,8t14, where t represents the year, with t=8 corresponding to 2008.arrow_forward
- Graphing Discrete Data Plot the data from the table in Exercise S-2. S-2. Testing Data for Linearity Test the following data to see whether they are linear. x 2 4 6 8 y 12 17 21 25arrow_forwardNoise and Intelligibility Audiologists study the intelligibility of spoken sentences under different noise levels. Intelligibility, the MRT score, is measured as the percent of a spoken sentence that the listener can decipher at a cesl4ain noise level in decibels (dB). The table shows the results of one such test. (a) Make a scatter plot of the data. (b) Find and graph the regression line. (c) Find the correlation coefficient. Is a linear model appropriate? (d) Use the linear model in put (b) to estimate the intelligibility of a sentence at a 94-dB noise level.arrow_forward
 Big Ideas Math A Bridge To Success Algebra 1: Stu...AlgebraISBN:9781680331141Author:HOUGHTON MIFFLIN HARCOURTPublisher:Houghton Mifflin Harcourt
 Holt Mcdougal Larson Pre-algebra: Student Edition...AlgebraISBN:9780547587776Author:HOLT MCDOUGALPublisher:HOLT MCDOUGAL
 Glencoe Algebra 1, Student Edition, 9780079039897...AlgebraISBN:9780079039897Author:CarterPublisher:McGraw Hill
 Algebra and Trigonometry (MindTap Course List)AlgebraISBN:9781305071742Author:James Stewart, Lothar Redlin, Saleem WatsonPublisher:Cengage Learning