Exploring Microeconomics
8th Edition
ISBN: 9781544339443
Author: Sexton, Robert L.
Publisher: Sage Publications, Inc., Corwin, Cq Press,
expand_more
expand_more
format_list_bulleted
Question
Chapter 4, Problem 17P
To determine
(a)
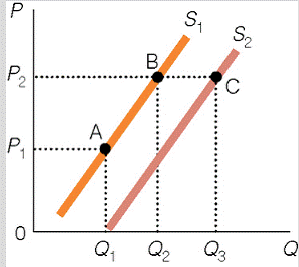
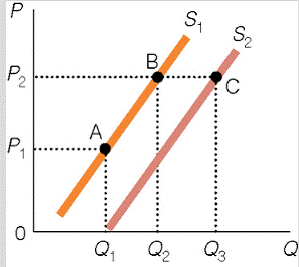
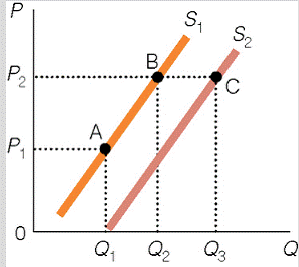
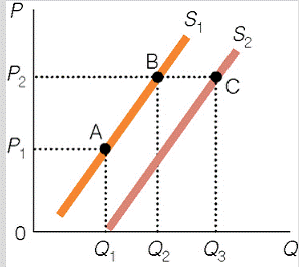
To define the shift from

To determine
(b)
Define movement of A to B called.

To determine
(c)
Define movement from B to A

To determine
(d)
Define the shift from

Expert Solution & Answer
Trending nowThis is a popular solution!
Learn your wayIncludes step-by-step video

schedule07:44
Students have asked these similar questions
Consider a market for Lemonade. Please use the accompanying graph to answer following questions. P is the price of Lemonade and Q is the quantity of Lemonade.
Please answer step by step follow question.Answer must be correct. Don,t copy from anywhere. Write proper answer. Answer follow image.Do all calculation step by step.
The following graph shows the market for cakes in San Francisco, where there are over 1,000 bakeries at any given moment. Suppose the number of
bakeries increases significantly.
tudy Tools
Show the effect of this change on the market for cakes by shifting one or both of the curves on the following graph, holding all else constant.
ns
Note: Select and drag one or both of the curves to the desired position. Curves will snap into position, so if you try to move
curve and it snaps back
ess Tips
to its original position, just drag it a little farther.
ess Tips
(?)
R YOU
Supply
Demand
ning
Supply
back
Demand
QUANTITY (Cakes)
MacBook Air
PRICE (Dollars per cake)
8. Shifts in supply or demand I
The following graph shows the market for donuts in Dallas, where there are over 1,000 donut shops at any given moment. Suppose a new scientific
study shows that Dallas is the most polluted city in the world. Due to health concerns, a significant number of families move out of the city.
Show the effect of this change on the market for donuts by shifting one or both of the curves on the following graph, holding all else constant.
Note: Select and drag one or both of the curves to the desired position. Curves will snap into position, so if you try to move a curve and it snaps back
to its original position, just drag it a little farther.
PRICE (Dollars per donut)
QUANTITY (Donuts)
Supply
Demand
Demand
If donuts are a normal good, this will cause the demand for donuts to
0
Supply
?
Now suppose Congress passes a new tax that decreases the income of Dallas residents.
Chapter 4 Solutions
Exploring Microeconomics
Knowledge Booster
Similar questions
- Consider the market for softdrinks in canada, where there are over a thousand stores that sell soft drinks at any given moment. Suppose the health authority issue a public warning that consuming soft drinks is not good for health. Holding all other factors constant, what will be the effect on market? Draw a graph and explain.arrow_forwardHow does the demand curve look like? Graph it.arrow_forwardDefine law of demand including a graph.arrow_forward
- Explain the simultaneous change in demand and supply with the help of graph?arrow_forwardPrice P₂ P1 Price ↓ (a) (c) D₂ D₁ Quantity Quantity Price (b) D₁ Quantity Main Carrow_forward3. Determinants of demand The following graph shows the demand curve for sedans (for example, Toyota Camrys or Honda Accords) in New York City. For simplicity, assume that all sedans are identical and sell for the same price. Initially, the graph shows market demand under the following circumstances: Average household income is $50,000 per year, the price of a gallon of gas is $4.00 per gallon. Use the graph input tool to help you answer the following questions. You will not be graded on any changes you make to this graph. Note: Once you enter a value in a white field, the graph and any corresponding amounts in each grey field will change accordingly. Graph Input Tool Demand for Sedans Demand for Sedans 40 I Price of a sedan 15 (Thousand of dollars) Quantity Demanded 563 (Sedans per month) Demand Shifters Average Income (Thousands of dollars) 50 Demand 10 Price of Gas 4 (Dollars per gallon) 100 200 300 400 500 600 700 800 900 QUANTITY (Sedans per month) PRICE (Thousands of dollars per…arrow_forward
- 11. Shifts in supply or demand I The following graph shows the market for hot dogs in Vancouver, where there are more than a thousand hot dog stands at any given moment. Suppose a new scientific study shows that Vancouver is the most polluted city in the world. Due to health concerns, a significant number of families move out of the city. Show the effect of this change on the market for hot dogs by shifting one or both of the curves on the following graph, holding all else constant. Supply Demand Supply Demand QUANTITY (Hot dogs) PRICE(Dollars per hot dog)arrow_forwardUsing a graph, explain carefully the difference between a movement along a demand curve and a shift in the demand curvearrow_forwardUse the following demand schedule for cherries to draw a graph of the demand curve. Be sure to label the demand curve and each axis, and show each point on the demand curve. Price (dollars per bushel) 60 50 40 30 20 Quantity (thousands of bushels) 40 80 120 160 200 Use the editor to format your answerarrow_forward
- How do u construct a graph showing supply and demand for the tablet case market? How are the laws of supply and demand illustrated in a graph.explain your answer.arrow_forwardTOPIC: Supply and demandIn the market for widgets, the supply and demand curve are “normal” 45° lines. The equilibrium price is £5 and the equilibrium quantity is 10 widgets. Show in a new graph how your answers would change if the supply curve was infinitely inelastic.arrow_forwardI need help with finding equilibrium point on this question? a retailer will buy 45 radios fom a wholesaler if the price is $10 each but only 20 if the price is $60. the wholesaler will supply 35 radios at $30 each and 70 radios at $50 each. assuming the supply and demand functions are linear, find the market equilibrium point. I started with using the equation for a line and moved on to demand equation, how do I find out the supply functions? Do I plug in the supply number as (P1,Q1) and (P2,Q2) and if they come out equal is that the equilibrium point or is there something I am missing?arrow_forward
arrow_back_ios
SEE MORE QUESTIONS
arrow_forward_ios
Recommended textbooks for you
 Exploring EconomicsEconomicsISBN:9781544336329Author:Robert L. SextonPublisher:SAGE Publications, Inc
 Economics (MindTap Course List)EconomicsISBN:9781337617383Author:Roger A. ArnoldPublisher:Cengage Learning
 Economics Today and Tomorrow, Student EditionEconomicsISBN:9780078747663Author:McGraw-HillPublisher:Glencoe/McGraw-Hill School Pub Co

Exploring Economics
Economics
ISBN:9781544336329
Author:Robert L. Sexton
Publisher:SAGE Publications, Inc


Economics (MindTap Course List)
Economics
ISBN:9781337617383
Author:Roger A. Arnold
Publisher:Cengage Learning


Economics Today and Tomorrow, Student Edition
Economics
ISBN:9780078747663
Author:McGraw-Hill
Publisher:Glencoe/McGraw-Hill School Pub Co