Exploring Economics
8th Edition
ISBN: 9781544336329
Author: Robert L. Sexton
Publisher: SAGE Publications, Inc
expand_more
expand_more
format_list_bulleted
Question
Chapter 4, Problem 11P
To determine
(a)
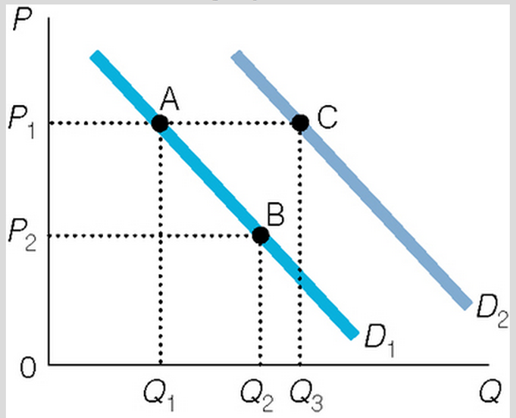
Define the Shift and movements from

To determine
(b)
Define the movement from B and A in the given graph.

To determine
(c)
Define the shift of movement from A to B in the given graph.

To determine
(d)
Define the movement and shift from

Expert Solution & Answer
Trending nowThis is a popular solution!

Students have asked these similar questions
Not use ai please
Not use ai please
Not use ai please
Knowledge Booster
Similar questions
- not use ai pleasearrow_forwardUse the following table to work Problems 5 to 9. Minnie's Mineral Springs, a single-price monopoly, faces the market demand schedule: Price Quantity demanded (dollars per bottle) 10 8 (bottles per hour) 0 1 6 2 4 3 2 4 0 5 5. a. Calculate Minnie's total revenue schedule. b. Calculate its marginal revenue schedule. 6. a. Draw a graph of the market demand curve and Minnie's marginal revenue curve. b. Why is Minnie's marginal revenue less than the price? 7. a. At what price is Minnie's total revenue maxi- mized? b. Over what range of prices is the demand for water from Minnie's Mineral Springs elastic? 8. Why will Minnie not produce a quantity at which the market demand for water is inelastic?arrow_forwardDon't give AI generated solution otherwise I will give you downward Give correct answer with explanationarrow_forward
- The Firm's Output Decision (Study Plan 12.2) Use the following table to work Problems 4 to 6. Pat's Pizza Kitchen is a price taker. Its costs are Output (pizzas per hour) Total cost (dollars per hour) 0 10 1 21 2 30 3 41 4 54 5 69 4. Calculate Pat's profit-maximizing output and economic profit if the market price is (i) $14 a pizza. (ii) $12 a pizza. (iii) $10 a pizza. 5. What is Pat's shutdown point and what is Pat's economic profit if it shuts down temporarily? 6. Derive Pat's supply curve.arrow_forwardUse the following table to work Problems 27 and 28. ProPainters hires students at $250 a week to paint houses. It leases equipment at $500 a week. The table sets out its total product schedule. Labor (students) 1 Output (houses painted per week) 2 23 5 3 9 4 12 5 14 6 15 27. If ProPainters paints 12 houses a week, calculate its total cost, average total cost, and marginal cost. At what output is average total cost a minimum? 28. Explain why the gap between ProPainters' total cost and total variable cost is the same no matter how many houses are painted.arrow_forwardUse the following table to work Problems 17 to 20. The table shows the production function of Jackie's Canoe Rides. Labor Output (rides per day) (workers per day) Plant 1 Plant 2 Plant 3 Plant 4 10 20 40 55 65 20 40 60 75 85 30 65 75 90 100 40 75 85 100 110 Canoes 10 20 30 40 Jackie's pays $100 a day for each canoe it rents and $50 a day for each canoe operator it hires. 19. a. On Jackie's LRAC curve, what is the average cost of producing 40, 75, and 85 rides a week? b. What is Jackie's minimum efficient scale?arrow_forward
arrow_back_ios
SEE MORE QUESTIONS
arrow_forward_ios
Recommended textbooks for you
 Exploring EconomicsEconomicsISBN:9781544336329Author:Robert L. SextonPublisher:SAGE Publications, Inc
 Economics Today and Tomorrow, Student EditionEconomicsISBN:9780078747663Author:McGraw-HillPublisher:Glencoe/McGraw-Hill School Pub Co
 Economics (MindTap Course List)EconomicsISBN:9781337617383Author:Roger A. ArnoldPublisher:Cengage Learning

 Microeconomics: Principles & PolicyEconomicsISBN:9781337794992Author:William J. Baumol, Alan S. Blinder, John L. SolowPublisher:Cengage Learning

Exploring Economics
Economics
ISBN:9781544336329
Author:Robert L. Sexton
Publisher:SAGE Publications, Inc

Economics Today and Tomorrow, Student Edition
Economics
ISBN:9780078747663
Author:McGraw-Hill
Publisher:Glencoe/McGraw-Hill School Pub Co

Economics (MindTap Course List)
Economics
ISBN:9781337617383
Author:Roger A. Arnold
Publisher:Cengage Learning


Microeconomics: Principles & Policy
Economics
ISBN:9781337794992
Author:William J. Baumol, Alan S. Blinder, John L. Solow
Publisher:Cengage Learning