
Concept explainers
Videos
To review:
The relation between the figure of the observations as shown and the table drawn by the researchers.
Given:
The oocytes of the frog Xenopus laevis were taken by the researchers and injected with the messenger ribonucleic acid (mRNA) of plant tonoplast intrinsic protein (TIP). The oocytes of the frog are known to have a larger size and a low osmotic cell permeability. The mRNA of a nontransport protein is also taken by the researchers and injected into the oocytes. Some of the oocytes were kept uninjected by them. These cells were observed after incubating them for 2 days in isotonic medium and then giving treatment with hypotonic solution. The following graph was made by plotting changes in relative volume on the y-axis and time on x-axis:
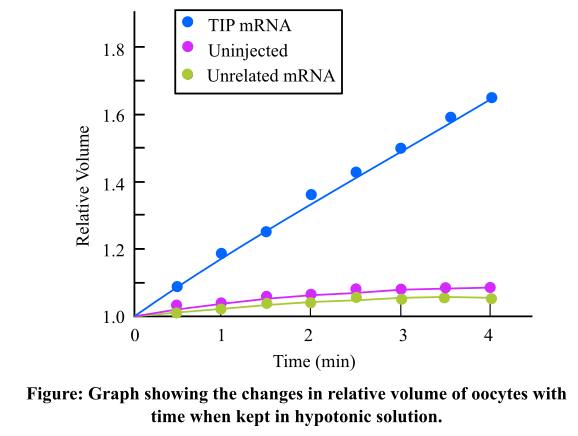
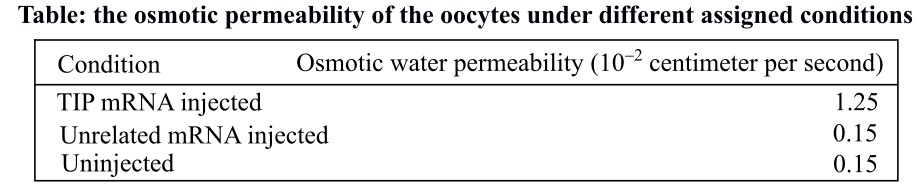
It was also observed that the oocytes, which had TIP mRNA, burst after sometime while the oocytes, which were injected with a different nontransport protein, and the oocytes which were kept uninjected do not burst. The following table depicts the osmotic water permeability of the three conditions as calculated by the researchers:
Introduction:
TIP is a transport protein present in the tonoplast of the plant cell. It helps in transportation just like the other aquaporins. Osmotic permeability of a membrane is its capability to transport water according to the concentration gradient. The higher the osmotic permeability, more will be the transport of water across the membrane.
Want to see the full answer?
Check out a sample textbook solution
Chapter 34 Solutions
Life: The Science of Biology


- Make a line graph for table 1 and table 2 each.arrow_forwardWhat does P-value indicate? In statistical analysis the results for two sets of data are presented with P < 0.01 and P<0.005. What does it mean?arrow_forwardWhat is the relationship of the two variables illustrated in the graph above?arrow_forward
- For the graph: a) Describe the graph: b) Describe the data: c) Interpret the data: Describe the statistics that are shown and what you can infer from them.arrow_forwardDoes the data in the table conform to the Hardy-Weinberg Equilibrium? Explainarrow_forwardCan you please explain the information in this slide and help answer the blue questions? Thank You!!arrow_forward
 Case Studies In Health Information ManagementBiologyISBN:9781337676908Author:SCHNERINGPublisher:Cengage
 Principles Of Radiographic Imaging: An Art And A ...Health & NutritionISBN:9781337711067Author:Richard R. Carlton, Arlene M. Adler, Vesna BalacPublisher:Cengage Learning