EP INTRODUCTION TO PROBABILITY+STAT.
14th Edition
ISBN: 2810019974203
Author: Mendenhall
Publisher: CENGAGE L
bartleby

Concept explainers

bartleby

Videos

Question
Book Icon
Chapter 3.4, Problem 3.10E

a.

To determine

Find the covariance sxy using bivariate data.

a.

Expert Solution
Check Mark

Answer to Problem 3.10E

  sxy=2

Explanation of Solution

Given:

The given bivariate data is (1,6),(3,2),and(2,4) .

Calculation:

First determine xiyi , xi and yi .

  xi first coordinates of the ordered pairs.

  yi second coordinates of the ordered pairs.

  xiyi=16+32+24=20xi=1+3+2=6yi=6+2+4=12

For covariance sxy using formula sxy=xiyi x i y i nn1 .

Where n= number of ordered pairs.

  n=3

  sxy=20 612331=20 72331=20242=42=2

Hence sxy=2 .

b.

To determine

Find the correlation coefficient r using bivariate data.

b.

Expert Solution
Check Mark

Answer to Problem 3.10E

The value of correlation coefficient r=1 .

Explanation of Solution

Given:

The given bivariate data is (1,6),(3,2),and(2,4) .

Calculation:

First determine xiyi , xi and yi .

  xi first coordinates of the ordered pairs.

  yi second coordinates of the ordered pairs.

  xiyi=16+32+24=20xi=1+3+2=6 x i2=12+32+22=14yi=6+2+4=12yi2=62+22+42=56

Find the sample variance s2 using the formula s2=xi2 x i 2 nn1

  sx2=14 6 2 331=14122=1sy2=56 12 2 331=56482=4

Find sample standard deviation.

  sx=1=1sy=4=2

For covariance sxy using formula sxy=xiyi x i y i nn1 .

Where n= number of ordered pairs.

  n=3

  sxy=20 612331=20 72331=20242=42=2

Find the correlation coefficient r using the formula r=sxysxsy .

  r=212=1

Hence the value of correlation coefficient r=1 .

c.

To determine

Find the regression line using the given points.

c.

Expert Solution
Check Mark

Answer to Problem 3.10E

The regression line is y=82x .

Explanation of Solution

Given:

The given bivariate data is (1,6),(3,2),and(2,4) .

Calculation:

First determine xiyi , xi and yi .

  xi first coordinates of the ordered pairs.

  yi second coordinates of the ordered pairs.

  xiyi=16+32+24=20xi=1+3+2=6 x i2=12+32+22=14yi=6+2+4=12yi2=62+22+42=56

Find the sample variance s2 using the formula s2=xi2 x i 2 nn1

  sx2=14 6 2 331=14122=1sy2=56 12 2 331=56482=4

Find sample standard deviation.

  sx=1=1sy=4=2

For covariance sxy using formula sxy=xiyi x i y i nn1 .

Where n= number of ordered pairs.

  n=3

  sxy=20 612331=20 72331=20242=42=2

Find the correlation coefficient r using the formula r=sxysxsy .

  r=212=1

Find the slope b using the formula b=rsysx

  b=121=2

Find the value of y-intercept.

  a=y¯bx¯= y i nb x i n=123(2)63=4+22=8

Regression line is y=a+bx

  y=82x

Hence the regression line is
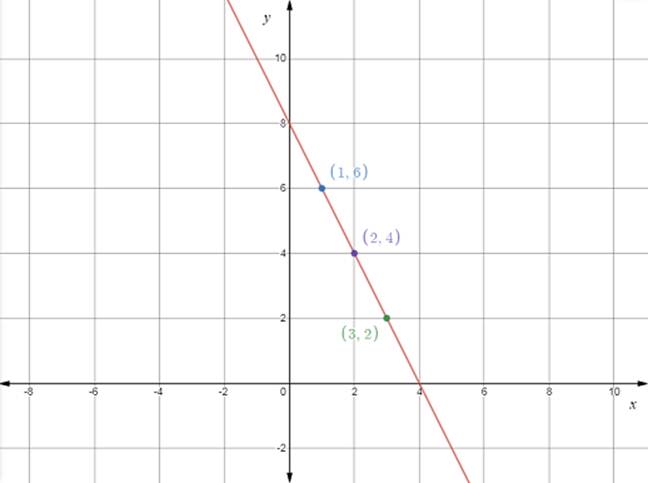
 y=82x .

d.

To determine

Draw a scatterplot for the given points.

d.

Expert Solution
Check Mark

Answer to Problem 3.10E

The scatterplot is

  EP INTRODUCTION TO PROBABILITY+STAT., Chapter 3.4, Problem 3.10E , additional homework tip  1

Explanation of Solution

Given:

The given bivariate data is (1,6),(3,2),and(2,4) .

Calculation:

The equation is y=82x .

The scatterplot for the given points are.

  EP INTRODUCTION TO PROBABILITY+STAT., Chapter 3.4, Problem 3.10E , additional homework tip  2

Want to see more full solutions like this?

Subscribe now to access step-by-step solutions to millions of textbook problems written by subject matter experts!
Knowledge Booster
Background pattern image
Statistics
Learn more about
Need a deep-dive on the concept behind this application? Look no further. Learn more about this topic, statistics and related others by exploring similar questions and additional content below.
Recommended textbooks for you
Text book image
Glencoe Algebra 1, Student Edition, 9780079039897...
Algebra
ISBN:9780079039897
Author:Carter
Publisher:McGraw Hill
Text book image
Calculus For The Life Sciences
Calculus
ISBN:9780321964038
Author:GREENWELL, Raymond N., RITCHEY, Nathan P., Lial, Margaret L.
Publisher:Pearson Addison Wesley,
Text book image
Algebra & Trigonometry with Analytic Geometry
Algebra
ISBN:9781133382119
Author:Swokowski
Publisher:Cengage
Text book image
College Algebra
Algebra
ISBN:9781337282291
Author:Ron Larson
Publisher:Cengage Learning
Text book image
Trigonometry (MindTap Course List)
Trigonometry
ISBN:9781337278461
Author:Ron Larson
Publisher:Cengage Learning
Text book image
Big Ideas Math A Bridge To Success Algebra 1: Stu...
Algebra
ISBN:9781680331141
Author:HOUGHTON MIFFLIN HARCOURT
Publisher:Houghton Mifflin Harcourt
Correlation Vs Regression: Difference Between them with definition & Comparison Chart; Author: Key Differences;https://www.youtube.com/watch?v=Ou2QGSJVd0U;License: Standard YouTube License, CC-BY
Correlation and Regression: Concepts with Illustrative examples; Author: LEARN & APPLY : Lean and Six Sigma;https://www.youtube.com/watch?v=xTpHD5WLuoA;License: Standard YouTube License, CC-BY