
Concept explainers
Videos
a.
Draw a
a.
Answer to Problem 3.21SE
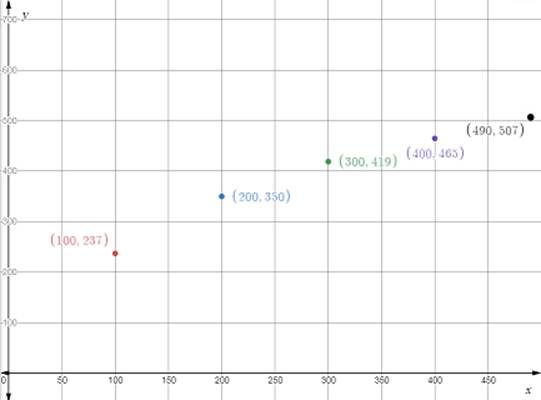
The scatterplot is.
Explanation of Solution
Given:
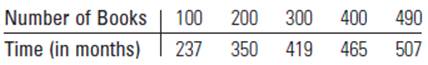
The table shows the data are the times (in months)required to write his books, in increments of
Calculation:
The scatterplot for the given points are.

The horizontal axis x represents the number of books and the vertical axis y represents the time (in months).
b.
Is the relationship between the two variables are linear?
b.
Answer to Problem 3.21SE
The relationship is not linear.
Explanation of Solution
Given:
The table shows the data are the times (in months) required to write his books, in increments of

Calculation:
The scatterplot for the given points are.

The horizontal axis x represents the number of books and the vertical axis y represents the time (in months).
In the scatterplot,
The pattern position is upward
Strength
Formed
Hence the relationship is not linear.
Want to see more full solutions like this?
Chapter 3 Solutions
EP INTRODUCTION TO PROBABILITY+STAT.


- Table 6 shows the year and the number ofpeople unemployed in a particular city for several years. Determine whether the trend appears linear. If so, and assuming the trend continues, in what year will the number of unemployed reach 5 people?arrow_forwardIf you travel 100 miles in two hours, then your average speed for the trip is Average speed=_________=________arrow_forward
 Algebra & Trigonometry with Analytic GeometryAlgebraISBN:9781133382119Author:SwokowskiPublisher:Cengage
 Glencoe Algebra 1, Student Edition, 9780079039897...AlgebraISBN:9780079039897Author:CarterPublisher:McGraw Hill
 Functions and Change: A Modeling Approach to Coll...AlgebraISBN:9781337111348Author:Bruce Crauder, Benny Evans, Alan NoellPublisher:Cengage Learning
 College AlgebraAlgebraISBN:9781305115545Author:James Stewart, Lothar Redlin, Saleem WatsonPublisher:Cengage Learning