
Videos
(a)
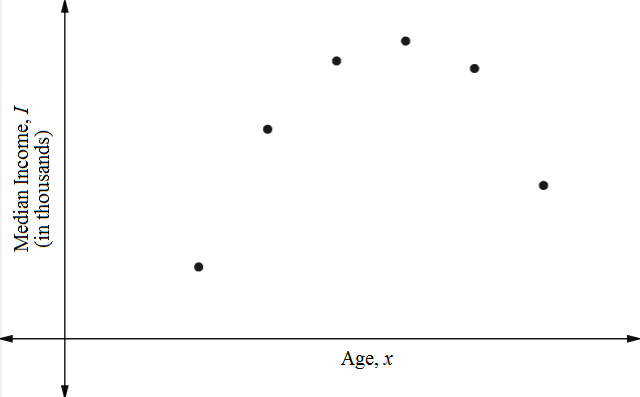
To draw: The
(a)
Answer to Problem 25AYU
Explanation of Solution
Given: An individual’s income varies with his or her age. The below table shows the median income I of males of different age groups within the United States for 2006. For each age group, let the class midpoint represent the independent variable x . For the class 65-years and older.
Using graphing utility to draw scatter plot.

(b)
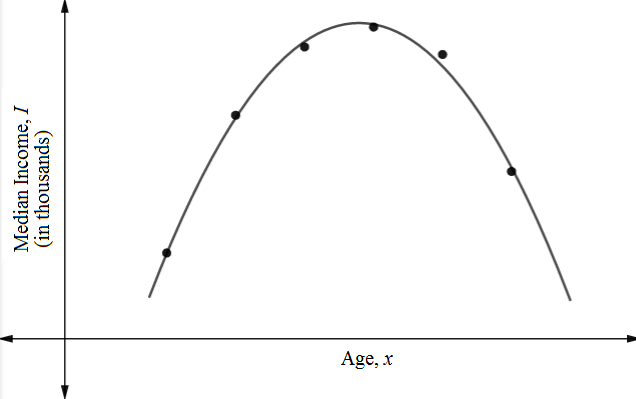
To find: The quadratic function of best fit that models.
(b)
Answer to Problem 25AYU
Explanation of Solution
Given: An individual’s income varies with his or her age. The below table shows the median income I of males of different age groups within the United States for 2006. For each age group, let the class midpoint represent the independent variable x . For the class 65-years and older.
Using graphing utility, the equation of quadratic of best fit.
(c)
To find: The age at which an individual earned the most income from the model
(c)
Answer to Problem 25AYU
Explanation of Solution
Given: An individual’s income varies with his or her age. The below table shows the median income I of males of different age groups within the United States for 2006. For each age group, let the class midpoint represent the independent variable x . For the class 65-years and older.
Using graphing utility, the equation of quadratic best fit.
This is
(d)
To find: The maximum income earn over the age.
(d)
Answer to Problem 25AYU
Explanation of Solution
Given: An individual’s income varies with his or her age. The below table shows the median income I of males of different age groups within the United States for 2006. For each age group, let the class midpoint represent the independent variable x . For the class 65-years and older.
Using graphing utility, the equation of quadratic best fit.
This is quadratic equation. At which age earn most income.
Therefore,
(e)
To find: The domain of function.
(e)
Answer to Problem 25AYU
Explanation of Solution
Given: An individual’s income varies with his or her age. The below table shows the median income I of males of different age groups within the United States for 2006. For each age group, let the class midpoint represent the independent variable x . For the class 65-years and older.
Using graphing utility, the quadratic best fit equation.

Chapter 3 Solutions
Precalculus
Additional Math Textbook Solutions
University Calculus: Early Transcendentals (4th Edition)
Precalculus: Concepts Through Functions, A Unit Circle Approach to Trigonometry (4th Edition)
Precalculus Enhanced with Graphing Utilities (7th Edition)
Calculus: Early Transcendentals (2nd Edition)


 Calculus: Early TranscendentalsCalculusISBN:9781285741550Author:James StewartPublisher:Cengage Learning
 Thomas' Calculus (14th Edition)CalculusISBN:9780134438986Author:Joel R. Hass, Christopher E. Heil, Maurice D. WeirPublisher:PEARSON
 Calculus: Early Transcendentals (3rd Edition)CalculusISBN:9780134763644Author:William L. Briggs, Lyle Cochran, Bernard Gillett, Eric SchulzPublisher:PEARSON
 Calculus: Early TranscendentalsCalculusISBN:9781319050740Author:Jon Rogawski, Colin Adams, Robert FranzosaPublisher:W. H. Freeman
 Calculus: Early Transcendental FunctionsCalculusISBN:9781337552516Author:Ron Larson, Bruce H. EdwardsPublisher:Cengage Learning