
Concept explainers
Videos
a.
To graph:
The graph of the weight gain and loss during pregnancy and the
Solution:
The graph of the weight gain and loss during pregnancy is as follows:
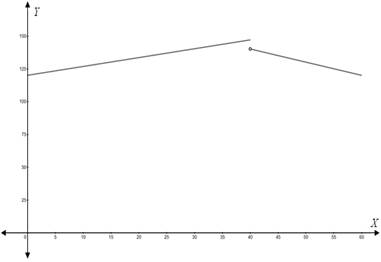
Explanation:
Given information:
A women’s weight naturally increases during pregnancy. When she delivers, her weight decreases immediately by the weight of the child. Suppose a
Formula used:
(1) Equation of the line passing through two points
Calculation:
Here, the vertical axis represents the weight and the horizontal axis represents the time period.
At time
So, coordinates are
Now to find the slope of the line passing through the coordinates
By using formula for the equation of the line passing through two points, it gives
By simplifying,
By multiplying by
By adding
Thus, the equation of line is
Now find the equation of the line passing through coordinates
By using the formula for the equation of a line passing through two points, it gives
By simplifying,
By multiplying by
By adding
Thus, the equation of the line is
Thus, we get the function for weight gain and loss during pregnancy and the
Therefore, the graph of the weight gain and loss during pregnancy and the

b.
Want to see the full answer?
Check out a sample textbook solution
Chapter 3 Solutions
Calculus For The Life Sciences


 Glencoe Algebra 1, Student Edition, 9780079039897...AlgebraISBN:9780079039897Author:CarterPublisher:McGraw Hill
 Trigonometry (MindTap Course List)TrigonometryISBN:9781337278461Author:Ron LarsonPublisher:Cengage Learning
 Algebra & Trigonometry with Analytic GeometryAlgebraISBN:9781133382119Author:SwokowskiPublisher:Cengage
 Big Ideas Math A Bridge To Success Algebra 1: Stu...AlgebraISBN:9781680331141Author:HOUGHTON MIFFLIN HARCOURTPublisher:Houghton Mifflin Harcourt