
Introductory Statistics (10th Edition)
10th Edition
ISBN: 9780321989178
Author: Neil A. Weiss
Publisher: PEARSON
expand_more
expand_more
format_list_bulleted
Concept explainers
Videos
Textbook Question
Chapter 3.2, Problem 95E
Days to Maturity. The first two columns of the following table provide a frequency distribution, using limit grouping, for the days to maturity of 40 short-term investments, as found in BARRON’S. The third column shows the class marks.
| Days to maturity | Frequency f | Class mark x |
| 30–39 | 3 | 34.5 |
| 40–49 | 1 | 44.5 |
| 50–59 | 8 | 54.5 |
| 60–69 | 10 | 64.5 |
| 70–79 | 7 | 74.5 |
| 80–89 | 7 | 84.5 |
| 90–99 | 4 | 94.5 |
- a. Use the grouped-data formulas to estimate the sample
mean and sample standard deviation of the days-to-maturity data. Round your final answers to one decimal place. - b. The following table gives the raw days-to-maturity data.
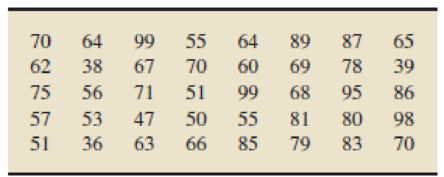
Using Definitions 3.4 and 3.6 on pages 99 and 108, respectively, gives the true sample mean and sample standard deviation of the days-to-maturity data as 68.3 and 16.7, respectively, rounded to one decimal place. Compare these actual values of
Expert Solution & Answer
Want to see the full answer?
Check out a sample textbook solution
Students have asked these similar questions
1. Determine whether the variable is categorical or numeric. If the variable is numeric,
determine whether the phenomenon of interest is discrete or continuous.
The income of the families of clients seen at the clinic.
Select one:
a. Numeric, continuous
b. Categorical
c. Numeric, discrete
i. In the early 2000s interest rates were low so many homeowners refinanced their home mortgages. Linda is a mortgage officer at Maybank Savings and Loan. Below is the amount refinanced for twenty loans she processed last week. The data are reported in thousands of dollars and arranged from smallest to largest.
59.2 59.5 61.6 65.5 66.6 72.9 74.8 77.3 79.2
83.7 85.6 85.8 86.6 87.0 87.1 90.2 93.3 98.6
100.2 100.7
a. Find the mean, median, 1stquartile and 3rd quartile
b. Draw a stem and leaf plot of the data using class width of 10
ii. The sales of Lexus automobiles in the Detroit area follow a Poisson distribution with a mean of 3 per day.
a. What is the probability that no Lexus is sold on a particular day?
b. What is the probability that for five consecutive days at least one Lexus is sold?
please help me with this question. please do not reject it
Sometimes, data must be modified before a stem-and-leaf plot may be constructed. For example, the data in the accompanying table represent
the five-year rate of return of 20 mutual funds and are reported to the hundredth decimal place. So, if we used the integer portion of the data as th
and the decimals as the leaves, then the stems would be 8, 9, 10, ..., 19; but the leaves would be two digits (such as 94, 53, and so on). This is m
acceptable since each leaf must be a single digit. To resolve this problem, we round the data to the nearest tenth. Complete parts (a) through (c)
Click the icon to view the table of five-year rates of return.
(a) Round the data to the nearest tenth.
10.11
9.89
11.18
8.27
9.04~
10.36
8.93
9.28
8.25
10.04≈
8.87
10.63
(b) Draw a stem-and-leaf plot of the modified data.
9.58
8.75
9.45~
11.49
9.48≈
11.24~
8.77~
8.57 ≈
Legend: 810 represents 8.0
(c) Describe the shape of the distribution. Choose the correct answer below.
||||
A. The distribution is skewed right…
Chapter 3 Solutions
Introductory Statistics (10th Edition)
Ch. 3.1 - Explain in detail the purpose of a measure of...Ch. 3.1 - Name and describe the three most important...Ch. 3.1 - Of the mean, median, and mode, which is the only...Ch. 3.1 - True or false: The mean, median, and mode can all...Ch. 3.1 - Consider the data set 1, 2, 3, 4, 5, 6, 7, 8, 9....Ch. 3.1 - Complete the following statement: A descriptive...Ch. 3.1 - Floor Space. The U.S. Department of Housing and...Ch. 3.1 - Net Worth. The Board of Governors of the Federal...Ch. 3.1 - In Exercises 3.93.14, we have provided simple data...Ch. 3.1 - In Exercises 3.93.14, we have provided simple data...
Ch. 3.1 - In Exercises 3.93.14, we have provided simple data...Ch. 3.1 - In Exercises 3.93.14, we have provided simple data...Ch. 3.1 - In Exercises 3.93.14, we have provided simple data...Ch. 3.1 - In Exercises 3.93.14, we have provided simple data...Ch. 3.1 - Explain what each symbol represents. a. b. n c. lCh. 3.1 - For a particular population, is the population...Ch. 3.1 - Consider these sample data: x1 = 1, x2 = 7, x3 =...Ch. 3.1 - Consider these sample data: x1 = 12, x2 = 8, x3 =...Ch. 3.1 - In Exercises 3.193.26, find the a. mean. b....Ch. 3.1 - In Exercises 3.193.26, find the a. mean. b....Ch. 3.1 - In Exercises 3.193.26, find the a. mean. b....Ch. 3.1 - In Exercises 3.193.26, find the a. mean. b....Ch. 3.1 - In Exercises 3.193.26, find the a. mean. b....Ch. 3.1 - In Exercises 3.193.26, find the a. mean. b....Ch. 3.1 - In Exercises 3.193.26, find the a. mean. b....Ch. 3.1 - Prob. 26ECh. 3.1 - Medieval Cremation Burials. In the article...Ch. 3.1 - Monthly Motorcycle Casualties. The Scottish...Ch. 3.1 - Daily Motorcycle Accidents. The Scottish...Ch. 3.1 - In each of Exercises 3.303.33, a. find n. b....Ch. 3.1 - In each of Exercises 3.303.33, a. find n. b....Ch. 3.1 - In each of Exercises 3.303.33, a. find n. b....Ch. 3.1 - In each of Exercises 3.303.33, a. find n. b....Ch. 3.1 - In each of Exercises 3.343.41, a. determine the...Ch. 3.1 - In each of Exercises 3.343.41, a. determine the...Ch. 3.1 - In each of Exercises 3.343.41, a. determine the...Ch. 3.1 - In each of Exercises 3.343.41, a. determine the...Ch. 3.1 - In each of Exercises 3.343.41, a. determine the...Ch. 3.1 - Prob. 39ECh. 3.1 - Prob. 40ECh. 3.1 - Prob. 41ECh. 3.1 - Prob. 42ECh. 3.1 - In each of Exercises 3.423.50, use the technology...Ch. 3.1 - Prob. 44ECh. 3.1 - Prob. 45ECh. 3.1 - Prob. 46ECh. 3.1 - Prob. 47ECh. 3.1 - Prob. 48ECh. 3.1 - Prob. 49ECh. 3.1 - Prob. 50ECh. 3.1 - In each of Exercises 3.513.52, a. use the...Ch. 3.1 - Prob. 52ECh. 3.1 - Food Choice. As you discovered earlier, ordinal...Ch. 3.1 - Outliers and Trimmed Means. Some data sets contain...Ch. 3.1 - Explain the difference between the quantities...Ch. 3.1 - Explain the difference between the quantities xiyi...Ch. 3.2 - Explain the purpose of a measure of variation.Ch. 3.2 - Why is the standard deviation preferable to the...Ch. 3.2 - When you use the standard deviation as a measure...Ch. 3.2 - Darts. The following dartboards represent darts...Ch. 3.2 - Prob. 61ECh. 3.2 - Consider the following four data sets. a. Compute...Ch. 3.2 - Age of U.S. Residents. The U.S. Census Bureau...Ch. 3.2 - Consider the data set 3, 3, 3, 3, 3, 3. a. Guess...Ch. 3.2 - Prob. 65ECh. 3.2 - In Exercises 3.653.70, we have provided simple...Ch. 3.2 - Prob. 67ECh. 3.2 - Prob. 68ECh. 3.2 - Prob. 69ECh. 3.2 - In Exercises 3.653.70, we have provided simple...Ch. 3.2 - In Exercises 3.713.78, determine the range and...Ch. 3.2 - In Exercises 3.713.78, determine the range and...Ch. 3.2 - In Exercises 3.713.78, determine the range and...Ch. 3.2 - In Exercises 3.713.78, determine the range and...Ch. 3.2 - Prob. 75ECh. 3.2 - In Exercises 3.713.78, determine the range and...Ch. 3.2 - In Exercises 3.713.78, determine the range and...Ch. 3.2 - Prob. 78ECh. 3.2 - Medieval Cremation Burials. In the article...Ch. 3.2 - Monthly Motorcycle Casualties. The Scottish...Ch. 3.2 - Daily Motorcycle Accidents. The Scottish...Ch. 3.2 - In each of Exercises 3.823.90, use the technology...Ch. 3.2 - Prob. 83ECh. 3.2 - Prob. 84ECh. 3.2 - In each of Exercises 3.823.90, use the technology...Ch. 3.2 - In each of Exercises 3.823.90, use the technology...Ch. 3.2 - Prob. 87ECh. 3.2 - Prob. 88ECh. 3.2 - Prob. 89ECh. 3.2 - In each of Exercises 3.823.90, use the technology...Ch. 3.2 - In each of Exercises 3.913.92, a. use the...Ch. 3.2 - In each of Exercises 3.913.92, a. use the...Ch. 3.2 - Outliers. In Exercise 3.54 on pages 104105, we...Ch. 3.2 - Weekly Salaries. In the following table, we repeat...Ch. 3.2 - Days to Maturity. The first two columns of the...Ch. 3.3 - Discuss the pros and cons of Chebyshevs rule.Ch. 3.3 - If the condition for using the empirical rule is...Ch. 3.3 - Apply Chebyshevs rule with k = 3 to verify that at...Ch. 3.3 - What does Chebyshevs rule say about the percentage...Ch. 3.3 - Prob. 100ECh. 3.3 - Prob. 101ECh. 3.3 - Consider the following data set. a. Draw a graph...Ch. 3.3 - Prob. 103ECh. 3.3 - Prob. 104ECh. 3.3 - Each of the following smooth curves represents the...Ch. 3.3 - Prob. 106ECh. 3.3 - Prob. 107ECh. 3.3 - Prob. 108ECh. 3.3 - Prob. 109ECh. 3.3 - Apply Chebyshevs rule to solve Exercises...Ch. 3.3 - Prob. 111ECh. 3.3 - Prob. 112ECh. 3.3 - Apply Chebyshevs rule to solve Exercises...Ch. 3.3 - Prob. 114ECh. 3.3 - Apply Chebyshevs rule to solve Exercises...Ch. 3.3 - Prob. 116ECh. 3.3 - Apply Chebyshevs rule to solve Exercises...Ch. 3.3 - Prob. 118ECh. 3.3 - Prob. 119ECh. 3.3 - In each of Exercises 3.1203.131, the quantitative...Ch. 3.3 - In each of Exercises 3.1203.131, the quantitative...Ch. 3.3 - In each of Exercises 3.1203.131, the quantitative...Ch. 3.3 - Prob. 123ECh. 3.3 - Prob. 124ECh. 3.3 - Prob. 125ECh. 3.3 - In each of Exercises 3.1203.131, the quantitative...Ch. 3.3 - Prob. 127ECh. 3.3 - Prob. 128ECh. 3.3 - Prob. 129ECh. 3.3 - Prob. 130ECh. 3.3 - Prob. 131ECh. 3.3 - Prob. 132ECh. 3.3 - Prob. 133ECh. 3.3 - Prob. 134ECh. 3.3 - In each of Exercises 3.1343.137, a. construct a...Ch. 3.3 - Prob. 136ECh. 3.3 - In each of Exercises 3.1343.137, a. construct a...Ch. 3.3 - Clocking the Cheetah. The cheetah (Acinonyx...Ch. 3.3 - Malnutrition and Poverty. R. Reifen et al. studied...Ch. 3.3 - In each of Exercises 3.1403.143, the quantitative...Ch. 3.3 - In each of Exercises 3.1403.143, the quantitative...Ch. 3.3 - In each of Exercises 3.1403.143, the quantitative...Ch. 3.3 - Prob. 143ECh. 3.3 - Prob. 144ECh. 3.3 - How many standard deviations to either side of the...Ch. 3.3 - How many standard deviations to either side of the...Ch. 3.3 - A data set consists of 2m2 1 zeros, one m, and...Ch. 3.4 - Identify by name three important groups of...Ch. 3.4 - Identify an advantage that the median and...Ch. 3.4 - Prob. 150ECh. 3.4 - Prob. 151ECh. 3.4 - Prob. 152ECh. 3.4 - Prob. 153ECh. 3.4 - Identify a use of the lower and upper limits.Ch. 3.4 - Prob. 155ECh. 3.4 - Which measure of variation is preferred when a....Ch. 3.4 - Fill in the blanks: Roughly, when arranged in...Ch. 3.4 - Fill in the blank: Roughly, when arranged in...Ch. 3.4 - Prob. 159ECh. 3.4 - Prob. 160ECh. 3.4 - Prob. 161ECh. 3.4 - Prob. 162ECh. 3.4 - Prob. 163ECh. 3.4 - Prob. 164ECh. 3.4 - Prob. 165ECh. 3.4 - Prob. 166ECh. 3.4 - In Exercises 3.1673.176, a. obtain and interpret...Ch. 3.4 - In Exercises 3.1673.176, a. obtain and interpret...Ch. 3.4 - Prob. 169ECh. 3.4 - Prob. 170ECh. 3.4 - In Exercises 3.1673.176, a. obtain and interpret...Ch. 3.4 - Prob. 172ECh. 3.4 - In Exercises 3.1673.176, a. obtain and interpret...Ch. 3.4 - Prob. 174ECh. 3.4 - In Exercises 3.1673.176, a. obtain and interpret...Ch. 3.4 - In Exercises 3.1673.176, a. obtain and interpret...Ch. 3.4 - Prob. 177ECh. 3.4 - Starting Salaries. The National Association of...Ch. 3.4 - Obesity. Researchers in obesity wanted to compare...Ch. 3.4 - Prob. 180ECh. 3.4 - Sickle Cell Disease. A study published by E....Ch. 3.4 - Prob. 182ECh. 3.4 - Prob. 183ECh. 3.4 - Prob. 184ECh. 3.4 - Prob. 185ECh. 3.4 - Prob. 186ECh. 3.4 - Prob. 187ECh. 3.4 - Prob. 188ECh. 3.4 - Prob. 189ECh. 3.4 - Prob. 190ECh. 3.4 - In each of Exercises 3.1883.191, a. use the...Ch. 3.5 - Identify each quantity as a parameter or a...Ch. 3.5 - Although, in practice, sample data are generally...Ch. 3.5 - Microwave Popcorn. For a given brand of microwave...Ch. 3.5 - Fill in the following blanks. a. A standardized...Ch. 3.5 - Identify the statistic that is used to estimate a....Ch. 3.5 - Augusta National Golf Course. Earlier in this...Ch. 3.5 - Augusta National Golf Course. Earlier in this...Ch. 3.5 - Heights of Basketball Players. In Section 3.2, we...Ch. 3.5 - Heights of Basketball Players. This exercise...Ch. 3.5 - In Exercises 3.2013.206, we have provided simple...Ch. 3.5 - In Exercises 3.2013.206, we have provided simple...Ch. 3.5 - In Exercises 3.2013.206, we have provided simple...Ch. 3.5 - In Exercises 3.2013.206, we have provided simple...Ch. 3.5 - In Exercises 3.2013.206, we have provided simple...Ch. 3.5 - In Exercises 3.2013.206, we have provided simple...Ch. 3.5 - Age of U.S. Residents. The U.S. Census Bureau...Ch. 3.5 - Chinchillidae Range. The family of mammals called...Ch. 3.5 - Atlantic Basin Hurricanes. The Tropical Cyclone...Ch. 3.5 - Dallas Mavericks. From the ESPN website, in the...Ch. 3.5 - STD Surveillance. The Centers for Disease Control...Ch. 3.5 - Dart Doubles. The top two players in the 20012002...Ch. 3.5 - Doing Time. According to Compendium of Federal...Ch. 3.5 - Gestation Periods of Humans. Gestation periods of...Ch. 3.5 - Frog Thumb Length. W. Duellman and J. Kohler...Ch. 3.5 - Prob. 216ECh. 3.5 - Low Gas Mileage. Suppose you buy a new car whose...Ch. 3.5 - Exam Scores. Suppose that you take an exam with...Ch. 3.5 - Prob. 219ECh. 3.5 - Consider a data set with m observations. If the...Ch. 3.5 - Prob. 221ECh. 3.5 - Stewed Tomatoes. A company produces cans of stewed...Ch. 3.5 - Prob. 223ECh. 3.5 - SAT Scores. Each year, thousands of high school...Ch. 3.5 - Copperhead and Tiger Snakes. S. Fearn et al....Ch. 3 - Define a. descriptive measures. b. measures of...Ch. 3 - Identify the two most commonly used measures of...Ch. 3 - Among the measures of center discussed, which is...Ch. 3 - Identify the most appropriate measure of variation...Ch. 3 - Prob. 5RPCh. 3 - Prob. 6RPCh. 3 - Prob. 7RPCh. 3 - Prob. 8RPCh. 3 - A quantitative data set of size 87 has mean 80 and...Ch. 3 - Prob. 10RPCh. 3 - Prob. 11RPCh. 3 - Prob. 12RPCh. 3 - Regarding outliers: a. What is an outlier? b....Ch. 3 - Regarding z-scores: a. How is a z-score obtained?...Ch. 3 - Party Time. An integral part of doing business in...Ch. 3 - Duration of Marriages. The National Center for...Ch. 3 - Causes of Death. The U.S. National Center for...Ch. 3 - Prob. 18RPCh. 3 - Prob. 19RPCh. 3 - Prob. 20RPCh. 3 - Prob. 21RPCh. 3 - Prices of New Mobile Homes. The U.S. Census Bureau...Ch. 3 - Millionaires. Refer to Problem 20. The ages of the...Ch. 3 - Prob. 24RPCh. 3 - A Better Golf Tee? An independent golf equipment...Ch. 3 - Prob. 26RPCh. 3 - UC Enrollment. According to the Statistical...Ch. 3 - Prob. 28RPCh. 3 - U.S. Divisions and Regions. The U.S. Census Bureau...Ch. 3 - Prob. 30RPCh. 3 - In Problems 3032, use the technology of your...Ch. 3 - In Problems 3032, use the technology of your...Ch. 3 - Vegetarians and Omnivores. Philosophical and...Ch. 3 - Recall from Chapter 1 (see page 34) that the Focus...Ch. 3 - At the beginning of this chapter (page 94), we...
Knowledge Booster


Learn more about
Need a deep-dive on the concept behind this application? Look no further. Learn more about this topic, statistics and related others by exploring similar questions and additional content below.Similar questions
- Suppose the following table shows the approximate price of a certain stock in December of each year from 2005 through 2014, as well as the 4-year moving averages for 2005 through 2007.† Complete the table by computing the remaining 4-year moving averages. (Note the peak in 2007 and the drop in subsequent years.) Round each average to the nearest dollar. (Chart in picture)arrow_forwardGiven below are the monthly values of the S&P 500 Index. Suppose that in each month you had written an out-of-the-money put option on one unit of the index with an exercise price 5% lower than the current value of the index. End of month S&P 500 End of month S&P 500 End of month S&P 500 End of month S&P 500 September-77 96.53 April-80 106.29 November-82 138.53 July-85 191.85 October-77 92.34 May-80 111.24 December-82 140.64 August-85 190.92 November-77 94.83 June-80 114.24 January-83 145.30 September-85 188.63 December-77 95.10 July-80 121.67 February-83 148.06 October-85 182.08 January-78 89.25 August-80 122.38 March-83 152.96 November-85 189.82 February-78 87.04 September-80 125.46 April-83 164.43 December-85 202.17 March-78 89.21 October-80 127.47 May-83 162.39 January-86 211.28 April-78 96.83 November-80 140.52 June-83 167.64 February-86 226.92 May-78 97.24 December-80 135.76 July-83 162.56 March-86 238.90 June-78 95.53 January-81…arrow_forwardThe "Dogs of the Dow" are the stocks listed on the Dow with the highest dividend yield. The following table shows the top 10 stocks of the "Dogs of the Dow" list for 2021, based on their performance the preceding year. Symbol Company Price ($) as of 12/31/2020 Yield as of 12/31/2020 CVX Chevron 84.45 6.11% IBM IBM 125.88 5.18% DOW Dow 55.50 5.05% WBA Walgreens 39.88 4.69% VZ Verizon 58.75 4.27% MMM 3M 174.79 3.36% CSCO Cisco 44.39 3.24% MRK Merck 81.80 3.18% AMGN Amgen 229.92 3.06% KO Coca-Cola 54.84 2.99% You decide to make a small portfolio consisting of a collection of 6 of the top 10 Dogs of the Dow. (a) How many portfolios are possible? portfolios (b) How many of these portfolios contain DOW but not MMM? portfolios (c) How many of these portfolios contain at most one stock priced above $100? portfoliosarrow_forward
- . If a startup churns 5.6% of its customers each month, then what is the average lifetime of a customer in months? 15.9 (rounded) 17.9 (rounded) 19.9 (rounded)arrow_forwardFind out the next month after april income by using the forecasting method of the moving average methodarrow_forwardLimpopo company has recorded quarterly maize sales and seasonal ratios from 2015 to 2017 financial year. Table 1 shows quarterly maize production sales with their seasonal ratios (SR). Table 1: Seasonal ratios for maize production sales. Year 2015 2016 Quarter Sales SR Q₁, Q₂, Q3, Q Q₁ ₂ 8, 12, 12, 10 Q₂, Q3, 10, 15, 14, 10 111.63, 87.87 83.33,122.45, 115.42, 84.18 Q4 Use Table 1 to calculate: a) the median seasonal indices (S) and their totals (S). b) the adjusted factor. c) the adjusted seasonal indices (S) and their totals (S.). Q₁ 9 Q₂ 14 2017 " Q3, Q₁ 14, 12 76.60 ,116.67, 113.09, 94.12arrow_forward
- Following the birth of a child, a parent wants to make an initial investment.. *picture belowarrow_forwardthe following table showsthe relationship between your wealth and your utility.arrow_forwardWhich of the following is not a good interpretation of a seasonal index of 1.26 for fall quarter sales? O a. Fall quarter sales are 26 perbent higher than the annual average. O b. Fall quarter sales represents 1.26 times the annual average. O c. Fall quarter sales represents an increase of 26 percent over last year's annual average. O d. Fall quarter sales average 126 percent of annual sales.arrow_forward
- Annualized percentage return on investment (as compared to the Standard & Poor's 500 Index) for 10 randomly selected stock screeners are reproduced in the table. Complete parts a through c.arrow_forwardA five-year project requires an investment of -112 and has the following cash flows in years 1 through 5, respectively (all cash flows in dollars): 48, 88, 34, 15, and 52. Find the difference between the Cauchy upper bound and the Cauchy lower bound. Write your answer as a percentage with two decimals; e.g., 23.55% but do not write the % sign. (Acceptable error = 0.50%)arrow_forwardA stock has monthly returns of 9%, 22%, 15%, and 28%. What is the stock's geometric average return?arrow_forward
arrow_back_ios
SEE MORE QUESTIONS
arrow_forward_ios
Recommended textbooks for you
 MATLAB: An Introduction with ApplicationsStatisticsISBN:9781119256830Author:Amos GilatPublisher:John Wiley & Sons Inc
 Probability and Statistics for Engineering and th...StatisticsISBN:9781305251809Author:Jay L. DevorePublisher:Cengage Learning
 Statistics for The Behavioral Sciences (MindTap C...StatisticsISBN:9781305504912Author:Frederick J Gravetter, Larry B. WallnauPublisher:Cengage Learning
 Elementary Statistics: Picturing the World (7th E...StatisticsISBN:9780134683416Author:Ron Larson, Betsy FarberPublisher:PEARSON
 The Basic Practice of StatisticsStatisticsISBN:9781319042578Author:David S. Moore, William I. Notz, Michael A. FlignerPublisher:W. H. Freeman
 Introduction to the Practice of StatisticsStatisticsISBN:9781319013387Author:David S. Moore, George P. McCabe, Bruce A. CraigPublisher:W. H. Freeman
MATLAB: An Introduction with Applications
Statistics
ISBN:9781119256830
Author:Amos Gilat
Publisher:John Wiley & Sons Inc
Probability and Statistics for Engineering and th...
Statistics
ISBN:9781305251809
Author:Jay L. Devore
Publisher:Cengage Learning
Statistics for The Behavioral Sciences (MindTap C...
Statistics
ISBN:9781305504912
Author:Frederick J Gravetter, Larry B. Wallnau
Publisher:Cengage Learning
Elementary Statistics: Picturing the World (7th E...
Statistics
ISBN:9780134683416
Author:Ron Larson, Betsy Farber
Publisher:PEARSON
The Basic Practice of Statistics
Statistics
ISBN:9781319042578
Author:David S. Moore, William I. Notz, Michael A. Fligner
Publisher:W. H. Freeman
Introduction to the Practice of Statistics
Statistics
ISBN:9781319013387
Author:David S. Moore, George P. McCabe, Bruce A. Craig
Publisher:W. H. Freeman
Sequences and Series Introduction; Author: Mario's Math Tutoring;https://www.youtube.com/watch?v=m5Yn4BdpOV0;License: Standard YouTube License, CC-BY
Introduction to sequences; Author: Dr. Trefor Bazett;https://www.youtube.com/watch?v=VG9ft4_dK24;License: Standard YouTube License, CC-BY