
Introductory Statistics (10th Edition)
10th Edition
ISBN: 9780321989178
Author: Neil A. Weiss
Publisher: PEARSON
expand_more
expand_more
format_list_bulleted
Concept explainers
Videos
Textbook Question
Chapter 3, Problem 15RP
Party Time. An integral part of doing business in the dot-com culture of the late 1990s was frequenting the party circuit centered in San Francisco. Here high-tech companies threw as many as five parties a night to recruit or retain talented workers in a highly competitive job market. With as many as 700 guests at a single party, the food and booze flowed, with an average alcohol cost per guest of $15–$18 and an average food bill of $75–$150. A sample of guests at a dot-com party yielded the following data on number of alcoholic drinks consumed per person. [SOURCE: USA TODAY Online]
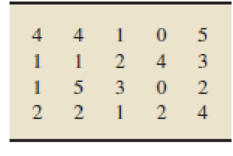
- a. Find the
mean , median, andmode of these data. - b. Which measure of center do you think is best here? Explain your answer.
Expert Solution & Answer
Want to see the full answer?
Check out a sample textbook solution
Students have asked these similar questions
An entrepreneur who owns and operates two businesses (A and B) would like to analyze
their profitability. They would like your help in the analysis. They give you the annual net
profit (in thousands of $) for each business from 2008-2020.
Table 1: Annual Net Profits for Businesses A and B
Business
Year
Profit
Business
Year
Profit
2008
-50
2008
-10
2009
57
2009
30
2010
71
2010
27
2011
64
2011
22
2012
60
2012
21
2013
50
2013
20
A
2014
41
2014
24
2015
59
2015
24
2016
71
2016
32
2017
71
2017
36
2018
74
2018
37
019
81
20
40
2020
97
2020
49
a. Suppose you want to graph the distribution of profits. Explain why using only one stem-
plot might not be optimal for the analysis.
b. Describe the correct stemplot to use. Generate this stemplot. Explain your steps. What
can you say about the distribution from this stemplot?
c. When are stemplots useful? And why is that?
d. Suppose that instead of having 26 observations you have 200 observations. What graph
should you generate?
e. What other type of…
. In 2010, of a total of 67,000 rooms on the Las Vegas Strip, Caesars Entertainment managed 22,880, while MGM Resorts managed over 12,000. However, owing to the Great Recession and new hotel openings, between 2008 and 2010, MGM's hotel occupancy decreased from 92% to 89%, while its average daily room rate fell from $148 to $108. Meanwhile, CityCenter, managed by MGM Resorts, and the Cosmopolitan opened with 4,000 and 3,000 rooms respectively, and the 1,720-room Sahara closed. (Sources: Caesars Entertainment Corp., Annual Report 2010; MGM Resorts, Annual Report 2010; "Sahara's closure on May 16 will mark `the end of an era'," Las Vegas Sun, March 11, 2011.)
(a) Using a suitable figure, explain how the opening of CityCenter and the Cosmopolitan affects the residual demand for an existing hotel and how it should adjust prices.
(b) If MGM Resorts had not reduced its room rates, what would have been the effect on occupancy?
(c) Use the Cournot model to explain…
IKEA has a contract to deliver 100, 250, 190, 140, 220, and 110 home windows over the next 6 months. Production cost (labor, material, and utilities) per window varies by period and is estimated to be $50, $45, $55, $48, $52, and $50 over the next 6 months. To take advantage of the fluctuations in manufacturing cost, IKEA can produce more windows than needed in a given month and hold the extra units for delivery in later months. This will incur a storage cost at the rate of $8 per window per month, assessed on the end-of season inventory. Now IKEA wants to minimize their respective cost. Based on this data answer the following questions
Qus.1)Write down the objective function of the linear programming consistent with the objective of IKEA.
Chapter 3 Solutions
Introductory Statistics (10th Edition)
Ch. 3.1 - Explain in detail the purpose of a measure of...Ch. 3.1 - Name and describe the three most important...Ch. 3.1 - Of the mean, median, and mode, which is the only...Ch. 3.1 - True or false: The mean, median, and mode can all...Ch. 3.1 - Consider the data set 1, 2, 3, 4, 5, 6, 7, 8, 9....Ch. 3.1 - Complete the following statement: A descriptive...Ch. 3.1 - Floor Space. The U.S. Department of Housing and...Ch. 3.1 - Net Worth. The Board of Governors of the Federal...Ch. 3.1 - In Exercises 3.93.14, we have provided simple data...Ch. 3.1 - In Exercises 3.93.14, we have provided simple data...
Ch. 3.1 - In Exercises 3.93.14, we have provided simple data...Ch. 3.1 - In Exercises 3.93.14, we have provided simple data...Ch. 3.1 - In Exercises 3.93.14, we have provided simple data...Ch. 3.1 - In Exercises 3.93.14, we have provided simple data...Ch. 3.1 - Explain what each symbol represents. a. b. n c. lCh. 3.1 - For a particular population, is the population...Ch. 3.1 - Consider these sample data: x1 = 1, x2 = 7, x3 =...Ch. 3.1 - Consider these sample data: x1 = 12, x2 = 8, x3 =...Ch. 3.1 - In Exercises 3.193.26, find the a. mean. b....Ch. 3.1 - In Exercises 3.193.26, find the a. mean. b....Ch. 3.1 - In Exercises 3.193.26, find the a. mean. b....Ch. 3.1 - In Exercises 3.193.26, find the a. mean. b....Ch. 3.1 - In Exercises 3.193.26, find the a. mean. b....Ch. 3.1 - In Exercises 3.193.26, find the a. mean. b....Ch. 3.1 - In Exercises 3.193.26, find the a. mean. b....Ch. 3.1 - Prob. 26ECh. 3.1 - Medieval Cremation Burials. In the article...Ch. 3.1 - Monthly Motorcycle Casualties. The Scottish...Ch. 3.1 - Daily Motorcycle Accidents. The Scottish...Ch. 3.1 - In each of Exercises 3.303.33, a. find n. b....Ch. 3.1 - In each of Exercises 3.303.33, a. find n. b....Ch. 3.1 - In each of Exercises 3.303.33, a. find n. b....Ch. 3.1 - In each of Exercises 3.303.33, a. find n. b....Ch. 3.1 - In each of Exercises 3.343.41, a. determine the...Ch. 3.1 - In each of Exercises 3.343.41, a. determine the...Ch. 3.1 - In each of Exercises 3.343.41, a. determine the...Ch. 3.1 - In each of Exercises 3.343.41, a. determine the...Ch. 3.1 - In each of Exercises 3.343.41, a. determine the...Ch. 3.1 - Prob. 39ECh. 3.1 - Prob. 40ECh. 3.1 - Prob. 41ECh. 3.1 - Prob. 42ECh. 3.1 - In each of Exercises 3.423.50, use the technology...Ch. 3.1 - Prob. 44ECh. 3.1 - Prob. 45ECh. 3.1 - Prob. 46ECh. 3.1 - Prob. 47ECh. 3.1 - Prob. 48ECh. 3.1 - Prob. 49ECh. 3.1 - Prob. 50ECh. 3.1 - In each of Exercises 3.513.52, a. use the...Ch. 3.1 - Prob. 52ECh. 3.1 - Food Choice. As you discovered earlier, ordinal...Ch. 3.1 - Outliers and Trimmed Means. Some data sets contain...Ch. 3.1 - Explain the difference between the quantities...Ch. 3.1 - Explain the difference between the quantities xiyi...Ch. 3.2 - Explain the purpose of a measure of variation.Ch. 3.2 - Why is the standard deviation preferable to the...Ch. 3.2 - When you use the standard deviation as a measure...Ch. 3.2 - Darts. The following dartboards represent darts...Ch. 3.2 - Prob. 61ECh. 3.2 - Consider the following four data sets. a. Compute...Ch. 3.2 - Age of U.S. Residents. The U.S. Census Bureau...Ch. 3.2 - Consider the data set 3, 3, 3, 3, 3, 3. a. Guess...Ch. 3.2 - Prob. 65ECh. 3.2 - In Exercises 3.653.70, we have provided simple...Ch. 3.2 - Prob. 67ECh. 3.2 - Prob. 68ECh. 3.2 - Prob. 69ECh. 3.2 - In Exercises 3.653.70, we have provided simple...Ch. 3.2 - In Exercises 3.713.78, determine the range and...Ch. 3.2 - In Exercises 3.713.78, determine the range and...Ch. 3.2 - In Exercises 3.713.78, determine the range and...Ch. 3.2 - In Exercises 3.713.78, determine the range and...Ch. 3.2 - Prob. 75ECh. 3.2 - In Exercises 3.713.78, determine the range and...Ch. 3.2 - In Exercises 3.713.78, determine the range and...Ch. 3.2 - Prob. 78ECh. 3.2 - Medieval Cremation Burials. In the article...Ch. 3.2 - Monthly Motorcycle Casualties. The Scottish...Ch. 3.2 - Daily Motorcycle Accidents. The Scottish...Ch. 3.2 - In each of Exercises 3.823.90, use the technology...Ch. 3.2 - Prob. 83ECh. 3.2 - Prob. 84ECh. 3.2 - In each of Exercises 3.823.90, use the technology...Ch. 3.2 - In each of Exercises 3.823.90, use the technology...Ch. 3.2 - Prob. 87ECh. 3.2 - Prob. 88ECh. 3.2 - Prob. 89ECh. 3.2 - In each of Exercises 3.823.90, use the technology...Ch. 3.2 - In each of Exercises 3.913.92, a. use the...Ch. 3.2 - In each of Exercises 3.913.92, a. use the...Ch. 3.2 - Outliers. In Exercise 3.54 on pages 104105, we...Ch. 3.2 - Weekly Salaries. In the following table, we repeat...Ch. 3.2 - Days to Maturity. The first two columns of the...Ch. 3.3 - Discuss the pros and cons of Chebyshevs rule.Ch. 3.3 - If the condition for using the empirical rule is...Ch. 3.3 - Apply Chebyshevs rule with k = 3 to verify that at...Ch. 3.3 - What does Chebyshevs rule say about the percentage...Ch. 3.3 - Prob. 100ECh. 3.3 - Prob. 101ECh. 3.3 - Consider the following data set. a. Draw a graph...Ch. 3.3 - Prob. 103ECh. 3.3 - Prob. 104ECh. 3.3 - Each of the following smooth curves represents the...Ch. 3.3 - Prob. 106ECh. 3.3 - Prob. 107ECh. 3.3 - Prob. 108ECh. 3.3 - Prob. 109ECh. 3.3 - Apply Chebyshevs rule to solve Exercises...Ch. 3.3 - Prob. 111ECh. 3.3 - Prob. 112ECh. 3.3 - Apply Chebyshevs rule to solve Exercises...Ch. 3.3 - Prob. 114ECh. 3.3 - Apply Chebyshevs rule to solve Exercises...Ch. 3.3 - Prob. 116ECh. 3.3 - Apply Chebyshevs rule to solve Exercises...Ch. 3.3 - Prob. 118ECh. 3.3 - Prob. 119ECh. 3.3 - In each of Exercises 3.1203.131, the quantitative...Ch. 3.3 - In each of Exercises 3.1203.131, the quantitative...Ch. 3.3 - In each of Exercises 3.1203.131, the quantitative...Ch. 3.3 - Prob. 123ECh. 3.3 - Prob. 124ECh. 3.3 - Prob. 125ECh. 3.3 - In each of Exercises 3.1203.131, the quantitative...Ch. 3.3 - Prob. 127ECh. 3.3 - Prob. 128ECh. 3.3 - Prob. 129ECh. 3.3 - Prob. 130ECh. 3.3 - Prob. 131ECh. 3.3 - Prob. 132ECh. 3.3 - Prob. 133ECh. 3.3 - Prob. 134ECh. 3.3 - In each of Exercises 3.1343.137, a. construct a...Ch. 3.3 - Prob. 136ECh. 3.3 - In each of Exercises 3.1343.137, a. construct a...Ch. 3.3 - Clocking the Cheetah. The cheetah (Acinonyx...Ch. 3.3 - Malnutrition and Poverty. R. Reifen et al. studied...Ch. 3.3 - In each of Exercises 3.1403.143, the quantitative...Ch. 3.3 - In each of Exercises 3.1403.143, the quantitative...Ch. 3.3 - In each of Exercises 3.1403.143, the quantitative...Ch. 3.3 - Prob. 143ECh. 3.3 - Prob. 144ECh. 3.3 - How many standard deviations to either side of the...Ch. 3.3 - How many standard deviations to either side of the...Ch. 3.3 - A data set consists of 2m2 1 zeros, one m, and...Ch. 3.4 - Identify by name three important groups of...Ch. 3.4 - Identify an advantage that the median and...Ch. 3.4 - Prob. 150ECh. 3.4 - Prob. 151ECh. 3.4 - Prob. 152ECh. 3.4 - Prob. 153ECh. 3.4 - Identify a use of the lower and upper limits.Ch. 3.4 - Prob. 155ECh. 3.4 - Which measure of variation is preferred when a....Ch. 3.4 - Fill in the blanks: Roughly, when arranged in...Ch. 3.4 - Fill in the blank: Roughly, when arranged in...Ch. 3.4 - Prob. 159ECh. 3.4 - Prob. 160ECh. 3.4 - Prob. 161ECh. 3.4 - Prob. 162ECh. 3.4 - Prob. 163ECh. 3.4 - Prob. 164ECh. 3.4 - Prob. 165ECh. 3.4 - Prob. 166ECh. 3.4 - In Exercises 3.1673.176, a. obtain and interpret...Ch. 3.4 - In Exercises 3.1673.176, a. obtain and interpret...Ch. 3.4 - Prob. 169ECh. 3.4 - Prob. 170ECh. 3.4 - In Exercises 3.1673.176, a. obtain and interpret...Ch. 3.4 - Prob. 172ECh. 3.4 - In Exercises 3.1673.176, a. obtain and interpret...Ch. 3.4 - Prob. 174ECh. 3.4 - In Exercises 3.1673.176, a. obtain and interpret...Ch. 3.4 - In Exercises 3.1673.176, a. obtain and interpret...Ch. 3.4 - Prob. 177ECh. 3.4 - Starting Salaries. The National Association of...Ch. 3.4 - Obesity. Researchers in obesity wanted to compare...Ch. 3.4 - Prob. 180ECh. 3.4 - Sickle Cell Disease. A study published by E....Ch. 3.4 - Prob. 182ECh. 3.4 - Prob. 183ECh. 3.4 - Prob. 184ECh. 3.4 - Prob. 185ECh. 3.4 - Prob. 186ECh. 3.4 - Prob. 187ECh. 3.4 - Prob. 188ECh. 3.4 - Prob. 189ECh. 3.4 - Prob. 190ECh. 3.4 - In each of Exercises 3.1883.191, a. use the...Ch. 3.5 - Identify each quantity as a parameter or a...Ch. 3.5 - Although, in practice, sample data are generally...Ch. 3.5 - Microwave Popcorn. For a given brand of microwave...Ch. 3.5 - Fill in the following blanks. a. A standardized...Ch. 3.5 - Identify the statistic that is used to estimate a....Ch. 3.5 - Augusta National Golf Course. Earlier in this...Ch. 3.5 - Augusta National Golf Course. Earlier in this...Ch. 3.5 - Heights of Basketball Players. In Section 3.2, we...Ch. 3.5 - Heights of Basketball Players. This exercise...Ch. 3.5 - In Exercises 3.2013.206, we have provided simple...Ch. 3.5 - In Exercises 3.2013.206, we have provided simple...Ch. 3.5 - In Exercises 3.2013.206, we have provided simple...Ch. 3.5 - In Exercises 3.2013.206, we have provided simple...Ch. 3.5 - In Exercises 3.2013.206, we have provided simple...Ch. 3.5 - In Exercises 3.2013.206, we have provided simple...Ch. 3.5 - Age of U.S. Residents. The U.S. Census Bureau...Ch. 3.5 - Chinchillidae Range. The family of mammals called...Ch. 3.5 - Atlantic Basin Hurricanes. The Tropical Cyclone...Ch. 3.5 - Dallas Mavericks. From the ESPN website, in the...Ch. 3.5 - STD Surveillance. The Centers for Disease Control...Ch. 3.5 - Dart Doubles. The top two players in the 20012002...Ch. 3.5 - Doing Time. According to Compendium of Federal...Ch. 3.5 - Gestation Periods of Humans. Gestation periods of...Ch. 3.5 - Frog Thumb Length. W. Duellman and J. Kohler...Ch. 3.5 - Prob. 216ECh. 3.5 - Low Gas Mileage. Suppose you buy a new car whose...Ch. 3.5 - Exam Scores. Suppose that you take an exam with...Ch. 3.5 - Prob. 219ECh. 3.5 - Consider a data set with m observations. If the...Ch. 3.5 - Prob. 221ECh. 3.5 - Stewed Tomatoes. A company produces cans of stewed...Ch. 3.5 - Prob. 223ECh. 3.5 - SAT Scores. Each year, thousands of high school...Ch. 3.5 - Copperhead and Tiger Snakes. S. Fearn et al....Ch. 3 - Define a. descriptive measures. b. measures of...Ch. 3 - Identify the two most commonly used measures of...Ch. 3 - Among the measures of center discussed, which is...Ch. 3 - Identify the most appropriate measure of variation...Ch. 3 - Prob. 5RPCh. 3 - Prob. 6RPCh. 3 - Prob. 7RPCh. 3 - Prob. 8RPCh. 3 - A quantitative data set of size 87 has mean 80 and...Ch. 3 - Prob. 10RPCh. 3 - Prob. 11RPCh. 3 - Prob. 12RPCh. 3 - Regarding outliers: a. What is an outlier? b....Ch. 3 - Regarding z-scores: a. How is a z-score obtained?...Ch. 3 - Party Time. An integral part of doing business in...Ch. 3 - Duration of Marriages. The National Center for...Ch. 3 - Causes of Death. The U.S. National Center for...Ch. 3 - Prob. 18RPCh. 3 - Prob. 19RPCh. 3 - Prob. 20RPCh. 3 - Prob. 21RPCh. 3 - Prices of New Mobile Homes. The U.S. Census Bureau...Ch. 3 - Millionaires. Refer to Problem 20. The ages of the...Ch. 3 - Prob. 24RPCh. 3 - A Better Golf Tee? An independent golf equipment...Ch. 3 - Prob. 26RPCh. 3 - UC Enrollment. According to the Statistical...Ch. 3 - Prob. 28RPCh. 3 - U.S. Divisions and Regions. The U.S. Census Bureau...Ch. 3 - Prob. 30RPCh. 3 - In Problems 3032, use the technology of your...Ch. 3 - In Problems 3032, use the technology of your...Ch. 3 - Vegetarians and Omnivores. Philosophical and...Ch. 3 - Recall from Chapter 1 (see page 34) that the Focus...Ch. 3 - At the beginning of this chapter (page 94), we...
Knowledge Booster


Learn more about
Need a deep-dive on the concept behind this application? Look no further. Learn more about this topic, statistics and related others by exploring similar questions and additional content below.Similar questions
- Problem: The restaurant of a 165-room year-round resort hotel depends entirely on its room quests for its revenue. Average annual room occupancy is 77%. On average, 3.6 people occupy each room in use. We know from past experience that 82% of the guests will eat breakfast, 27% will eat lunch, and 55% will eat dinner in the resort's dining room. The average checks per meal are: Breakfast Lunch $8.50 $12.25 $19.87 Dinner The restaurant is open every day of the year. Calculate the annual (for 365 days) food revenue for a non-leap year, showing your calculations. *ensure all calculations are rounded to two decimal places to arrive at the correct answer 18 C Cloudy hparrow_forwardThe manager of a 100-unit apartment complex knows from experience that all units will be occupied if the rent is $500 per month. A market survey suggest that, on average, one additional unit will remain vacant for each $10 increase in rent. What rent should the manager charge to maximize revenue?arrow_forwardA grocery store is reevaluating the retail price of their oranges. They have a contract where they can purchase oranges for $0.52 per pound. However, this includes high quality oranges (about 40% of the time), low quality oranges (55%), and occasionally rotten fruit (5%). Suppose they sell 80% of all high quality oranges at $1.99 per pound, 65% of all low quality oranges at $1.49 per pound (they offer a sale), and they cannot sell any of the rotten fruit. What is the store's expected profit from a random shipment of 500 pounds of oranges? We do not consider personnel and other overhead costs, only the wholesale cost of the oranges. (Give your answer as a number, no dollar sign included.)arrow_forward
- New legislation passed in 2017 by the U.S. Congress changed tax laws that affect how many people file their taxes in 2018 and beyond. These tax law changes will likely lead many people to seek tax advice from their accountants (The New York Times). Backen and Hayes LLC is an accounting firm in New York state. The accounting firm believes that it may have to hire additional accountants to assist with the increased demand in tax advice for the upcoming tax season. Backen and Hayes LLC has developed the following probability distribution for a = number of new clients seeking tax advice. Excel File: data05-19.xlsx f(x) 20 0.05 25 0.20 30 0.25 35 0.15 40 0.15 45 0.10 50 0.10 a. Is this a valid probability distribution? - Select your answer - Explain. f(z) Select your answer - - Select your answer b. What is the probability that Backen and Hayes LLC will obtain 40 or more new clients (to 2 decimals)? c. What is the probability that Backen and Hayes LLC will obtain fewer than 35 new clients…arrow_forwardNew legislation passed in 2017 by the U.S. Congress changed tax laws that affect how many people file their taxes in 2018 and beyond. These tax law changes will likely lead many people to seek tax advice from their accountants (The New York Times). Backen and Hayes LLC is an accounting firm in New York state. The accounting firm believes that it may have to hire additional accountants to assist with the increased demand in tax advice for the upcoming tax season. Backen and Hayes LLC has developed the following probability distribution for number of new clients seeking tax advice. x f(x) 20 0.05 25 0.20 30 0.25 35 0.15 40 0.15 45 0.10 50 0.10 b. What is the probability that Backen and Hayes LLC will obtain 40 or more new clients (to 2 decimals c. What is the probability that Backen and Hayes LLC will obtain fewer than 35 new clients (to 2 decimals)? d.Compute the expected value, variance, and standard deviation of (to 2 decimals). Expected value…arrow_forwardPlease answer C. and D. Palisades Eco-Park is a small ecological reserve that admits a relatively small number of visitors on any day, but provides both educational and entertaining lectures, exhibitions, and opportunities to observe nature. The company has collected the following data on labor costs and number of visitors to the park over the last 30 months. Month Labor Cost Visitors 1 $ 25,820 1,700 2 $ 36,290 2,592 3 $ 39,968 2,811 4 $ 31,648 2,222 5 $ 34,809 2,373 6 $ 32,672 2,181 7 $ 32,023 2,205 8 $ 38,334 2,676 9 $ 38,568 2,760 10 $ 46,933 3,572 11 $ 42,157 2,976 12 $ 39,030 2,804 13 $ 34,444 2,415 14 $ 33,173 2,336 15 $ 36,971 2,508 16 $ 26,500 2,099 17 $ 30,663 3,397 18 $ 29,961 2,786 19 $ 27,590 2,412 20 $ 30,003 2,972 21 $ 25,692 2,000 22 $ 24,655 1,794 23 $ 28,892 3,267 24 $ 30,153 3,817 25 $ 28,119 2,592 26 $ 31,690 3,274 27 $ 28,651 2,989 28 $ 29,927 3,050 29 $ 28,438 2,511 30 $ 27,874 2,075…arrow_forward
- New legislation passed in 2017 by the U.S. Congress changed tax laws that affect how many people file their taxes in 2018 and beyond. These tax law changes will likely lead many people to seek tax advice from their accountants (The New York Times). Backen and Hayes LLC is an accounting firm in New York state. The accounting firm believes that it may have to hire additional accountants to assist with the increased demand in tax advice for the upcoming tax season. Backen and Hayes LLC has developed the following probability distribution for * = number of new clients seeking tax advice. Excel File: data05-19.xlsx f(2) 20 0.05 25 0.20 30 0.25 35 0.15 40 0.15 45 0.10 50 0.10 a. Is this a valid probability distribution? - Select your answer - Explain. f(x) Select your answer - Select your answer - b. What is the probability that Backen and Hayes LLC will obtain 40 or more new clients (to 2 decimals)? c. What is the probability that Backen and Hayes LLC will obtain fewer than 35 new clients…arrow_forwardCompanies in the U.S. car rental market vary greatly in terms of the size of the fleet, the number of locations, and annual revenue. In 2011, Hertz had 320,000 cars in service and annual revenue of approximately $4.2 billion. Suppose the following data show the number of cars in service (1,000s) and the annual revenue ($ millions) for six smaller car rental companies. Company Cars (1,000s) Revenue ($ millions) Company A 11.5 116 Company B 10 137 Company C 9 102 Company D 5.5 39 Company E 4.2 38 Company F 3.3 30 (a) Develop a scatter diagram with the number of cars in service as the independent variable. (b) What does the scatter diagram developed in part (a) indicate about the relationship between the two variables? (c) Use the least squares method to develop the estimated regression equation that can be used to predict annual revenue (in $ millions) given the number of cars in service (in 1,000s). (Round your numerical values to three decimal…arrow_forwardCompanies in the U.S. car rental market vary greatly in terms of the size of the fleet, the number of locations, and annual revenue. In 2011, Hertz had 320,000 cars in service and annual revenue of approximately $4.2 billion. Suppose the following data show the number of cars in service (1,000s) and the annual revenue ($ millions) for six smaller car rental companies. Company Cars(1,000s) Revenue($ millions) Company A 11.5 118 Company B 10.0 137 Company C 9.0 102 Company D 5.5 39 Company E 4.2 40 Company F 3.3 32 (a) Develop a scatter diagram with the number of cars in service as the independent variable. A scatter diagram has 6 points plotted on it. The horizontal axis ranges from 0 to 14 and is labeled: Cars in Service (1,000s). The vertical axis ranges from 0 to 160 and is labeled: Annual Revenue ($ millions). The points are plotted from left to right in an upward, diagonal direction starting from the lower left corner of the diagram and are between 3 to 12 on…arrow_forward
- Companies in the U.S. car rental market vary greatly in terms of the size of the fleet, the number of locations, and annual revenue. In 2011, Hertz had 320,000 cars in service and annual revenue of approximately $4.2 billion. Suppose the following data show the number of cars in service (1,000s) and the annual revenue ($ millions) for six smaller car rental companies. Company Cars(1,000s) Revenue($ millions) Company A 11.5 116 Company B 10.0 133 Company C 9.0 98 Company D 5.5 37 Company E 4.2 40 Company F 3.3 32 a.Use the least squares method to develop the estimated regression equation that can be used to predict annual revenue (in $ millions) given the number of cars in service (in 1,000s). (Round your numerical values to three decimal places.) b. For every additional car placed in service, estimate how much annual revenue will change (in dollars). (Round your answer to the nearest integer.) Annual revenue will increase by $ , for every additional car placed in…arrow_forwardCompanies in the U.S. car rental market vary greatly in terms of the size of the fleet, the number of locations, and annual revenue. In 2011, Hertz had 320,000 cars in service and annual revenue of approximately $4.2 billion. Suppose the following data show the number of cars in service (1,000s) and the annual revenue ($ millions) for six smaller car rental companies. Company Cars(1,000s) Revenue($ millions) Company A 11.5 118 Company B 10.0 133 Company C 9.0 98 Company D 5.5 37 Company E 4.2 40 Company F 3.3 30 (a) Develop a scatter diagram with the number of cars in service as the independent variable. A scatter diagram has 6 points plotted on it. The horizontal axis ranges from 0 to 14 and is labeled: Cars in Service (1,000s). The vertical axis ranges from 0 to 160 and is labeled: Annual Revenue ($ millions). The points are plotted from left to right in an upward, diagonal direction starting from the lower left corner of the diagram and are between 3 to 12 on…arrow_forwardThe manager of a 100-unit apartment complex knows from experience that all units will be occupied if the rent is $700 per month. A market survey suggests that, on average, one additional unit will remain vacant for each $10 increase in rent. What rent (in dollars per month) should the manager charge to maximize revenue?arrow_forward
arrow_back_ios
SEE MORE QUESTIONS
arrow_forward_ios
Recommended textbooks for you
 MATLAB: An Introduction with ApplicationsStatisticsISBN:9781119256830Author:Amos GilatPublisher:John Wiley & Sons Inc
 Probability and Statistics for Engineering and th...StatisticsISBN:9781305251809Author:Jay L. DevorePublisher:Cengage Learning
 Statistics for The Behavioral Sciences (MindTap C...StatisticsISBN:9781305504912Author:Frederick J Gravetter, Larry B. WallnauPublisher:Cengage Learning
 Elementary Statistics: Picturing the World (7th E...StatisticsISBN:9780134683416Author:Ron Larson, Betsy FarberPublisher:PEARSON
 The Basic Practice of StatisticsStatisticsISBN:9781319042578Author:David S. Moore, William I. Notz, Michael A. FlignerPublisher:W. H. Freeman
 Introduction to the Practice of StatisticsStatisticsISBN:9781319013387Author:David S. Moore, George P. McCabe, Bruce A. CraigPublisher:W. H. Freeman
MATLAB: An Introduction with Applications
Statistics
ISBN:9781119256830
Author:Amos Gilat
Publisher:John Wiley & Sons Inc
Probability and Statistics for Engineering and th...
Statistics
ISBN:9781305251809
Author:Jay L. Devore
Publisher:Cengage Learning
Statistics for The Behavioral Sciences (MindTap C...
Statistics
ISBN:9781305504912
Author:Frederick J Gravetter, Larry B. Wallnau
Publisher:Cengage Learning
Elementary Statistics: Picturing the World (7th E...
Statistics
ISBN:9780134683416
Author:Ron Larson, Betsy Farber
Publisher:PEARSON
The Basic Practice of Statistics
Statistics
ISBN:9781319042578
Author:David S. Moore, William I. Notz, Michael A. Fligner
Publisher:W. H. Freeman
Introduction to the Practice of Statistics
Statistics
ISBN:9781319013387
Author:David S. Moore, George P. McCabe, Bruce A. Craig
Publisher:W. H. Freeman
Mod-01 Lec-01 Discrete probability distributions (Part 1); Author: nptelhrd;https://www.youtube.com/watch?v=6x1pL9Yov1k;License: Standard YouTube License, CC-BY
Discrete Probability Distributions; Author: Learn Something;https://www.youtube.com/watch?v=m9U4UelWLFs;License: Standard YouTube License, CC-BY
Probability Distribution Functions (PMF, PDF, CDF); Author: zedstatistics;https://www.youtube.com/watch?v=YXLVjCKVP7U;License: Standard YouTube License, CC-BY
Discrete Distributions: Binomial, Poisson and Hypergeometric | Statistics for Data Science; Author: Dr. Bharatendra Rai;https://www.youtube.com/watch?v=lHhyy4JMigg;License: Standard Youtube License