Concept explainers
a.
The zeroes of the given function
a.
Answer to Problem 44PPS
The zero of the given function is 8.
Explanation of Solution
Given:
Where,
p is the percents of process left to complete.
t is the time in minutes that the solution is left on the hair.
Calculation:
In order to find the zero of the function, put p = 0.
Conclusion:
Hence, the zero of the function is 8.
b.
To plot the graph of the situation.
b.
Explanation of Solution
Given:
Calculation of graph:
Consider,
| Values of t | Values of f(t) |
| 0 | 100 |
| 1 | 87.5 |
| 2 | 75 |
| 3 | 62.5 |
| 8 | 0 |
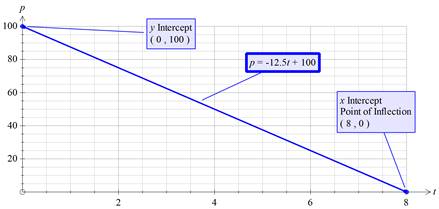
Using the above table, the graph can be plotted.
Graph:

Interpretation:
x-intercept: The graph intersects the x-axis at about (8,0), hence the x-intercept will be 8. This means in 8 minutes the whole process will be completed.
y-intercept: The graph intersects the y-axis at about (0,100), hence the y-intercept will be 100. This means that initially no percentage of the process is completed..
Conclusion:
Hence, the graph obtained is a line.
c.
To explain what the zero represents.
c.
Explanation of Solution
Given:
Where,
p is the percents of process left to complete.
t is the time in minutes that the solution is left on the hair.
Calculation:
In order to find the zero of the function, put p = 0.
So, at t=8 minutes, p=0%, which means the whole process is completed by this time.
d.
To state the domain and range of this function.
d.
Answer to Problem 44PPS
Domain:
Range:
Explanation of Solution
Given:
Where,
p is the percents of process left to complete.
t is the time in minutes that the solution is left on the hair.
Since the t represents time, it will start with 0 minutes and go until 8 minutes (which is the zero of the function) and beyond that the value of p will become negative which is not possible because p represents the percentage which will lie in
Hence,
Domain:
Range:
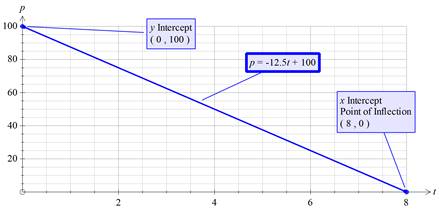
The above statement can be verified with the graph also.
Calculation of graph:
Consider,
| Values of t | Values of f(t) |
| 0 | 100 |
| 1 | 87.5 |
| 2 | 75 |
| 3 | 62.5 |
| 8 | 0 |
Using the above table the graph can be plotted.
Graph:

Interpretation:
x-intercept: The graph intersects the x-axis at about (8,0), hence the x-intercept will be 8. This means in 8 minutes the whole process will be completed.
y-intercept: The graph intersects the y-axis at about (0,100), hence the y-intercept will be 100. This means that initially no percentage of the process is completed..
Conclusion:
Hence from the statement and graph it can be concluded that:
Domain:
Range:
Chapter 3 Solutions
Algebra 1, Homework Practice Workbook (MERRILL ALGEBRA 1)
Additional Math Textbook Solutions
Elementary Statistics: Picturing the World (7th Edition)
College Algebra with Modeling & Visualization (5th Edition)
Pre-Algebra Student Edition
University Calculus: Early Transcendentals (4th Edition)
A First Course in Probability (10th Edition)
 Algebra and Trigonometry (6th Edition)AlgebraISBN:9780134463216Author:Robert F. BlitzerPublisher:PEARSON
 Contemporary Abstract AlgebraAlgebraISBN:9781305657960Author:Joseph GallianPublisher:Cengage Learning
 Linear Algebra: A Modern IntroductionAlgebraISBN:9781285463247Author:David PoolePublisher:Cengage Learning
 Algebra And Trigonometry (11th Edition)AlgebraISBN:9780135163078Author:Michael SullivanPublisher:PEARSON
 Introduction to Linear Algebra, Fifth EditionAlgebraISBN:9780980232776Author:Gilbert StrangPublisher:Wellesley-Cambridge Press
 College Algebra (Collegiate Math)AlgebraISBN:9780077836344Author:Julie Miller, Donna GerkenPublisher:McGraw-Hill Education


