Concept explainers
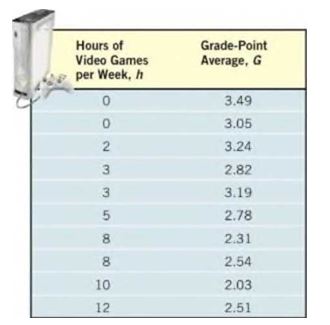
Video Games and Grade-Point Average Professor Grant Alexander wanted to find a linear model that relates the number of hours a student plays video games each week. , to the cumulative grade-point average. , of the student. He obtained a random sample of 10 full-time students at his college and asked each student to disclose the number of hours spent playing video games and the student’s cumulative grade-point average.

(a) Explain why the number of hours spent playing video games is the independent variable and cumulative grade-point average is the dependent variable.
(b) Use a graphing utility to draw a
(c) Use a graphing utility to find the line of best fit that models the relation between number of hours of video game playing each week and grade-point average. Express the model using function notation.
(d) Interpret the slope.
(e) Predict the grade-point average of a student who plays video games for 8 hours each week.
(f) How many hours of video game playing do you think a student plays whose grade-point average is ?
Want to see the full answer?
Check out a sample textbook solution
Chapter 3 Solutions
Precalculus Enhanced with Graphing Utilities (7th Edition)
- Good Day, Kindly assist with the following query. Regards,arrow_forwardExample 1 Solve the following differential equations: dy dx ex = 3x²-6x+5 dy dx = 4, y(0) = 3 x dy dx 33 = 5x3 +4 Prof. Robdera 5 -10:54 1x ㅁ +arrow_forward21. First-Order Constant-Coefficient Equations. a. Substituting y = ert, find the auxiliary equation for the first-order linear equation ay+by = 0, where a and b are constants with a 0. b. Use the result of part (a) to find the general solution.arrow_forward
- Let f be a function whose graph consists of 5 line segments and a semicircle as shown in the figure below. Let g(x) = √ƒƒ(t) dt . 0 3 2 -2 2 4 5 6 7 8 9 10 11 12 13 14 15 1. g(0) = 2. g(2) = 3. g(4) = 4. g(6) = 5. g'(3) = 6. g'(13)=arrow_forwardThe expression 3 | (3+1/+1) of the following integrals? A Ов E + + + + 18 3+1+1 3++1 3++1 (A) √2×14 dx x+1 (C) 1½-½√ √ ² ( 14 ) d x (B) √31dx (D) So 3+x -dx is a Riemann sum approximation of which 5 (E) 1½√√3dx 2x+1arrow_forward2. Suppose the population of Wakanda t years after 2000 is given by the equation f(t) = 45000(1.006). If this trend continues, in what year will the population reach 50,000 people? Show all your work, round your answer to two decimal places, and include units. (4 points)arrow_forward
 Glencoe Algebra 1, Student Edition, 9780079039897...AlgebraISBN:9780079039897Author:CarterPublisher:McGraw Hill
 Holt Mcdougal Larson Pre-algebra: Student Edition...AlgebraISBN:9780547587776Author:HOLT MCDOUGALPublisher:HOLT MCDOUGAL
 Functions and Change: A Modeling Approach to Coll...AlgebraISBN:9781337111348Author:Bruce Crauder, Benny Evans, Alan NoellPublisher:Cengage Learning
 College AlgebraAlgebraISBN:9781305115545Author:James Stewart, Lothar Redlin, Saleem WatsonPublisher:Cengage Learning


