
Concept explainers
Videos
The Center for Science in the Public Interest evaluated school cafeterias in 20 school districts across the United States. Each district was assigned a numerical score on the basis of rigor of food codes, frequency of food safety inspections, access to inspection information, and the results of cafeteria inspections. Based on the score assigned, each district was also assigned one of four grades.
The scores and grades are summarized in the accompanying table, which appears in the report “Making the Grade: An Analysis of Food Safety in School Cafeterias”(cspi.us/new/
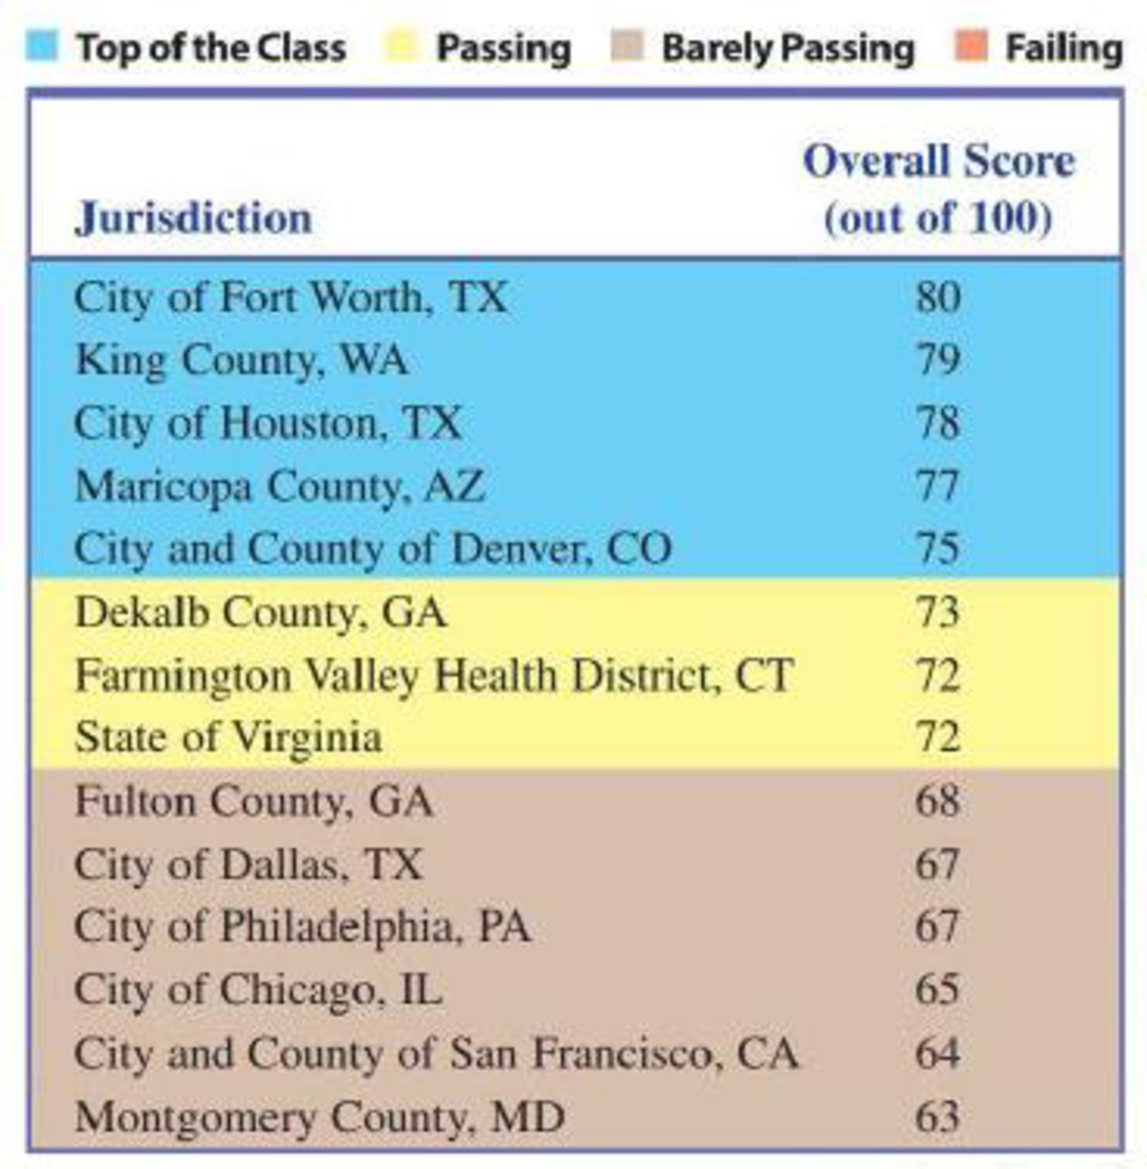
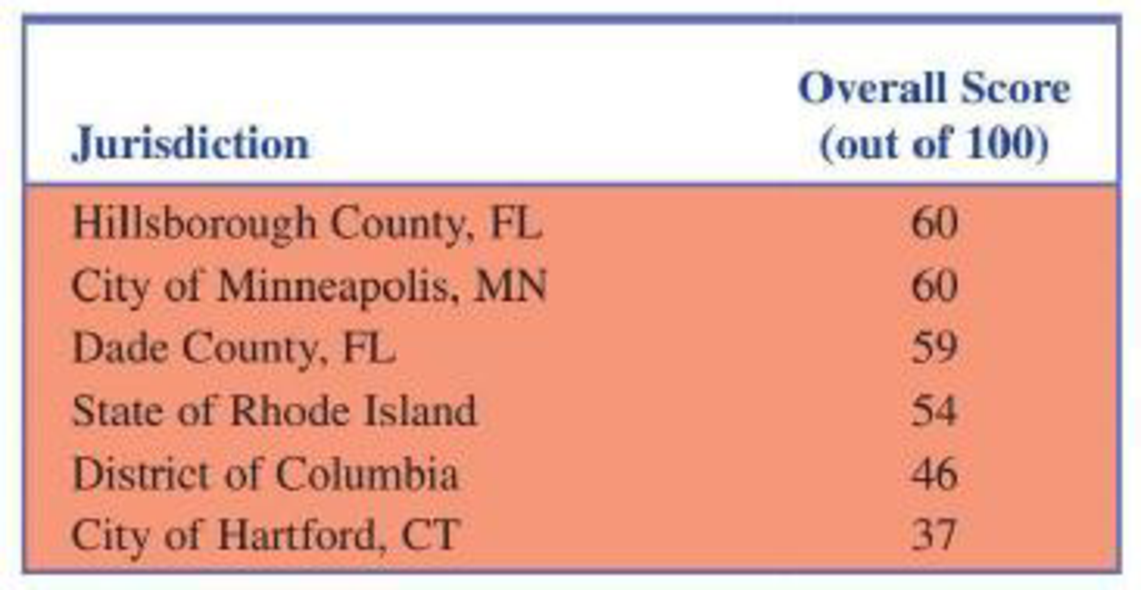
- a. Two variables are summarized in the figure, grade and overall score. Is overall score a numerical or categorical variable? Is grade (indicated by the different colors in the figure) a numerical or categorical variable?
- b. Explain how the figure is equivalent to a segmented bar chart of the grade data.

Trending nowThis is a popular solution!

Chapter 3 Solutions
Introduction To Statistics And Data Analysis
Additional Math Textbook Solutions
Business Statistics: A First Course (7th Edition)
Developmental Mathematics (9th Edition)
Statistics for Business and Economics (13th Edition)
Elementary Statistics (Text Only)
Elementary Statistics (13th Edition)


 Glencoe Algebra 1, Student Edition, 9780079039897...AlgebraISBN:9780079039897Author:CarterPublisher:McGraw Hill
 Holt Mcdougal Larson Pre-algebra: Student Edition...AlgebraISBN:9780547587776Author:HOLT MCDOUGALPublisher:HOLT MCDOUGAL
 College Algebra (MindTap Course List)AlgebraISBN:9781305652231Author:R. David Gustafson, Jeff HughesPublisher:Cengage Learning
 Big Ideas Math A Bridge To Success Algebra 1: Stu...AlgebraISBN:9781680331141Author:HOUGHTON MIFFLIN HARCOURTPublisher:Houghton Mifflin Harcourt