Concept explainers
(a)
Tocalculate:The time rate and the date on which the amount of daylight increasing at the fastest rate.
(a)
Answer to Problem 21E
The required date is April 1st; and the rate is 0.15 hours per day.
Explanation of Solution
Given information:
Starting period is January 1.
End period is December 31.
Each vertical ticks corresponds to 3 hours.
Each month has 30 days.
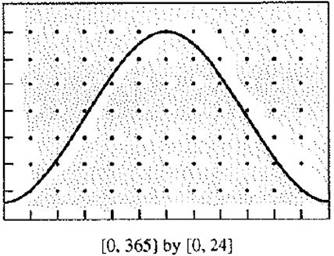
Daylight graph

Formula Used:
Slop formula of a straight line:
Slop between two points
Calculation:
At the highest point where the graph has the steepest positive curve, the sum of daylight would grow. From the given graph steepest points is at
Given that each month has 30 days, represented by the horizontal ticks.
Thus, after 90 days the month will be April 1.
Now, find the slop at that point,
Here each vertical tick corresponds to 3 hours.
Consider the points of the graph 30 days before and 30 days later than April 1.
Consider 30 days before
Thus the points are (60, 6) and (120, 15).
Calculate the slop between these points. Use the slop formula of a straight line.
Hence, the required date is April 1st; and the rate is 0.15 hours per day.
(b)
The days on which the rate of change in the amount of daylight is zero.
(b)
Answer to Problem 21E
The required days are January 1 and July 1.
Explanation of Solution
Given information:
Starting period is January 1.
End period is December 31.
Each vertical ticks corresponds to 3 hours.
Each month has 30 days.
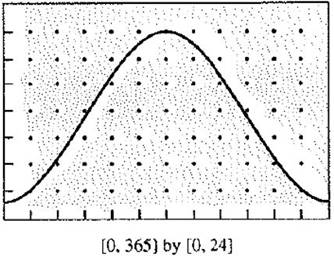
Daylight graph

If the slop of the graph is zero, the rate of change will be zero.
In the graph the points where the graphstops increasing and starts decreasing or stop decreasing and starts increasing, slop will zero.
There are two points where the slop is zero. These are at
Now, find the month at
From the graph at
At
Hence, the required days are January 1 and July 1.
(c)
The dates on which the rate of change in the number of daylight hours positive.
(c)
Answer to Problem 21E
The rate of change is positive from January 1 to 30 June and the negative rate of change is from July 1 to 31 December.
Explanation of Solution
Given information:
Starting period is January 1.
End period is December 31.
Each vertical ticks corresponds to 3 hours.
Each month has 30 days.
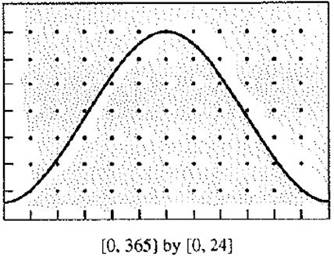
Daylight graph

Find the positive rate of change.
The exchange rate is positive where the graph increases. From the graph it can be seen that the curve is increases from 1 January until 30 June.
Thus, the rate is positive from 1 January to 30 June.
Similarly find the negative rate of change.
The exchange rate is negative if the graph reduces. From the graph it can be seen that the curve is decreases from 1 July to 31 December.
Hence, the rate of change is positive from January 1 to 30 June and the negative rate of change is from July 1 to 31 December.
Conclusion:
Chapter 3 Solutions
Calculus 2012 Student Edition (by Finney/Demana/Waits/Kennedy)
Additional Math Textbook Solutions
Calculus for Business, Economics, Life Sciences, and Social Sciences (14th Edition)
A First Course in Probability (10th Edition)
A Problem Solving Approach To Mathematics For Elementary School Teachers (13th Edition)
Elementary Statistics
College Algebra with Modeling & Visualization (5th Edition)
Calculus: Early Transcendentals (2nd Edition)
 Calculus: Early TranscendentalsCalculusISBN:9781285741550Author:James StewartPublisher:Cengage Learning
 Thomas' Calculus (14th Edition)CalculusISBN:9780134438986Author:Joel R. Hass, Christopher E. Heil, Maurice D. WeirPublisher:PEARSON
 Calculus: Early Transcendentals (3rd Edition)CalculusISBN:9780134763644Author:William L. Briggs, Lyle Cochran, Bernard Gillett, Eric SchulzPublisher:PEARSON
 Calculus: Early TranscendentalsCalculusISBN:9781319050740Author:Jon Rogawski, Colin Adams, Robert FranzosaPublisher:W. H. Freeman
 Calculus: Early Transcendental FunctionsCalculusISBN:9781337552516Author:Ron Larson, Bruce H. EdwardsPublisher:Cengage Learning


