
Videos
Electronic devices contain electric circuits etched into wafers made of silicon. These silicon wafers are sealed with an ultrathin layer of silicon dioxide, in a process known as oxidation. This can be done with either new or recycled wafers.
In a study described in the book Statistical Case Studies for Industrial Process Improvement by V. Czitrom and P. Spagon, both new and recycled wafers were oxidized, and the thicknesses of the layers were measured to determine whether they tended to differ between the two types of wafers. Recycled wafers are cheaper than new wafer, so the hope was that they would perform at least as well as the new wafers. Following are 36 thickness measurements (in tenth s of a nanometer) for both new and recycled wafers.
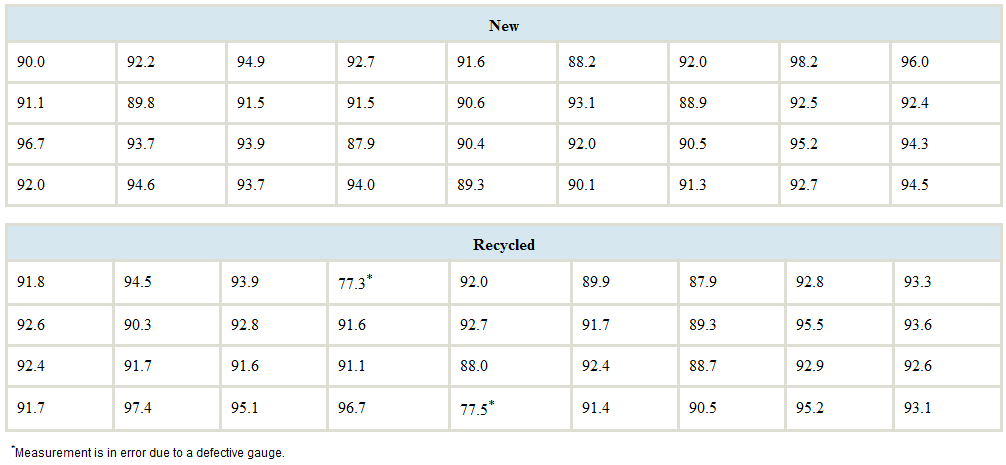
Suppose that it is desired to use the type of wafer whose distribution has less spread. Write a brief paragraph that explains which type of wafer to use and why. Which measure is more useful for spread in this case, the standard deviation or the
Want to see the full answer?
Check out a sample textbook solution
Chapter 3 Solutions
Elementary Statistics ( 3rd International Edition ) Isbn:9781260092561


- Lichen has a high absorbance capacity for radiation fallout from nuclear accidents. Since lichen is a major source for Alaskan caribou, and caribou is major food source tor the Alaskan villagers, it is important to monitor the level of radioactivity in lichen. Researcher at the University of Alaska, Fairbanks, collected 9 lichen specimens and measured the amount in micro-curies per milliliter) of the radioactive element cesium-137 for each. Using the Minitab software, it was found that the mean and standard deviation for the 9 observations were X = 0.009027 аnd s = 0.004854 A) Give a point estimate for the mean amount of cesium in lichen specimens collected in Alaska. B) Give the t- value used in a small sample 95% confidence interval for the true mean amount of cesium in Alaskan lichen specimens. C) Form a 95% confidence interval for the true mean amount of cesium in Alaskan lichen specimens. D) Give a practical interpretation for the interval you obtained in part C. E) What…arrow_forwardThe DENR has a new procedure to detect algal bloom in water being tested. This new procedure is important because, it could be used to detect three different contaminants-organic pollutants, volatile solvents, and chlorinated compounds. The department claims that it can detect high levels of organic pollutants with 99.95% accuracy, volatile solvents with 89.70% accuracy, and chlorinated compounds with 99.70% accuracy. If an algal bloom is not present, the test does not signal. Samples are prepared for the calibration of the test and 60% of them are contaminated with organic pollutants, 27% with volatile solvents, and 13% with traces of chlorinated compounds. A test sample is selected randomly. Denote as follows: S = signal, O = organic pollutants, V = volatile solvents, C = chlorinated compounds. If the test signals, what is the probability that chlorinated compounds are present? (Show complete solution in your answer sheet) O a. P(CIS) = 0.1386 Ob.P(C|S) = 0.1184 OC. None among the…arrow_forwardA sociologist wants to determine if the life expectancy of people in Africa is less than the life expectancy of people in Asia. The data obtained is shown in the table below. Africa Asia = 63.3 yr. 1 X,=65.2 yr. 2 o, = 9.1 yr. = 7.3 yr. n1 = 120 = 150arrow_forward
- In the manufacturing of a chemical adhesive, 3% of all batches have raw materials from two different lots. This occurs when holding tanks are replenished and the remaining portion of a lot is insufficient to fill the tanks. Only 5% of batches with material from a single lot require reprocessing. However, the viscosity of batches consisting of two or more lots of material is more difficult to control, and 40% of such batches require additional processing to achieve the required viscosity. Let A denote the event that a batch is formed from two different lots, and let B denote the event that a lot requires additional processing. Determine the following probabilities: а. Р(А) e. P(ANB) f. P(ANB') g. P(B) b. P(А) С. Р[ВА) d. P(B|A')arrow_forwardIn the manufacturing of a chemical adhesive, 3% of all batches have raw materials from two different lots. This occurs when holding tanks are replenished and the remaining portion of a lot is insufficient to fill the tanks. Only 5% of batches with material from a single lot require reprocessing. However, the viscosity of batches consisting of two or more lots of material is more difficult to control, and 40% of such batches require additional processing to achieve the required viscosity. Let A denote the event that a batch is formed from two different lots, and let B denote the event that a lot requires additional processing. Determine the following probabilities: a. P(A) b. P(AL с. Р[ВА) d. P(BIA') e. P(ANB) f. P(ANB) g. P(B)arrow_forwardAn investigation was conducted into the dust content in the flue gases of two types of solid-fuel boilers. Thirteen boilers of type A and nine boilers of type B were used under identical fueling and extraction conditions. Over a similar period, the quantities of dust were deposited in similar traps inserted in each of the twenty-two flues. Presented below are the collected dust content (in grams) given the source broiler type. Type A 73.1 56.4 82.1 67.2 78.7 75.1 48.0 53.3 55.5 61.5 60.6 55.2 63.1 Type B 53.0 39.3 55.8 58.8 41.2 66.6 46.0 56.4 58.9 questions are in inserted imagearrow_forward
- Cellulon, a manufacturer of home insulation, wants to develop guidelines for builders and consumers on how the thickness of the insulation in the attic of a home and the outdoor temperature affect natural gas consumption. In the laboratory, it varied the insulation thickness and temperature. A few of the findings are:arrow_forwardTo investigate water quality, the Columbus Dispatch took water specimens at 16 Ohio State Park swimming areas in central Ohio. Those specimens were taken to laboratories and tested for E. coli, which are bacteria that can cause serious gastrointestinal problems. For reference, if a 100-milliliter specimen (about 3.3 ounces) of water contains more than 130 E. coli bacteria, it is considered unsafe. The E. coli levels per 100 milliliters found by the laboratories are presented in the table: 291.0 10.9 47.0 86.0 44.0 18.9 1.0 50.0 190.4 45.7 28.5 18.9 16.0 34.0 8.6 9.6 To access the complete data set, click the link for your preferred software format: Excel Minitab JMP SPSS TI R Mac-TXT PC-TXT CSV CrunchIt! Find the mean E. coli level. Mean E.coli level (rounded to two decimal places) per 100 mlarrow_forwardradon is a colorless, odorless gas that is naturally released by rocks and soils and may concentrate in tightly closed houses. because radon is slightly radioactive, there is some concern that it may be a health hazard. radon detectors are sold to homeowners worried about this risk, but the detectors may be inaccurate. university researchers placed 12 detectors in a chamber where they were exposed to 105 picocuries per liter (pci/l) of radon over 3 years. here are the readings given by the detectors:91.9 97.8 111.4 112.3 105.4 85.0 103.8 89.6 96.6 109.3 104.8 91.7 Assume (unrealistically) that you know that the standard deviation of readings for all detectors of this type is σ = 9. a. Give the 95% confidence interval for the mean reading μ for this type of detector. b. Is there significant evidence at the 5% level that the mean reading differs from the true value 105? State hypotheses and base a test on your confidence interval from (a). c. Calculate the power of this test against the…arrow_forward
- The compressive strength of an alloy fastener used in aircraft construction is being studied. Ten loads were selected over the range 2500–4300 psi, and a number of fasteners were tested at those loads. The numbers of fasteners failing at each load were recorded. The complete test data are shown in Table E11-14.arrow_forwardAn article in the ASCE Journal of Energy Engineering [“Overview of Reservoir Release Improvements at 20 TVA Dams” (Vol. 125, April 1999, pp. 1–17)] presents data on dissolved oxygen concentrations in streams below 20 dams in the Tennessee Valley Authority system. The observations are (in milligrams per liter):arrow_forwardTwo different analytical methods were used to determine residual chlorine in sewage effluents. Both methods were used on the same samples, but each sample came from various locations with differing amounts of contact time with the effluent. Two methods were used to determine the concentration of Cl in mg/L, and the results are shown in the following table: Sample Method A Method B 1 0.39 0.36 2 0.84 1.35 3 1.76 2.56 4 3.35 3.92 5 4.69 5.35 6 7.70 8.33 7 10.52 10.70 8 10.92 10.91 a) What type of t-test should be used to compare the two methods and why? b) Do the two methods give different results? State and test the appropriate hypotheses. c) Does the conclusion depend on whether the 90%, 95%, or 99% confidence levels are used?arrow_forward
 MATLAB: An Introduction with ApplicationsStatisticsISBN:9781119256830Author:Amos GilatPublisher:John Wiley & Sons Inc
 Probability and Statistics for Engineering and th...StatisticsISBN:9781305251809Author:Jay L. DevorePublisher:Cengage Learning
 Statistics for The Behavioral Sciences (MindTap C...StatisticsISBN:9781305504912Author:Frederick J Gravetter, Larry B. WallnauPublisher:Cengage Learning
 Elementary Statistics: Picturing the World (7th E...StatisticsISBN:9780134683416Author:Ron Larson, Betsy FarberPublisher:PEARSON
 The Basic Practice of StatisticsStatisticsISBN:9781319042578Author:David S. Moore, William I. Notz, Michael A. FlignerPublisher:W. H. Freeman
 Introduction to the Practice of StatisticsStatisticsISBN:9781319013387Author:David S. Moore, George P. McCabe, Bruce A. CraigPublisher:W. H. Freeman