
MATLAB: An Introduction with Applications
6th Edition
ISBN: 9781119256830
Author: Amos Gilat
Publisher: John Wiley & Sons Inc
expand_more
expand_more
format_list_bulleted
Related questions
Topic Video
Question
thumb_up100%
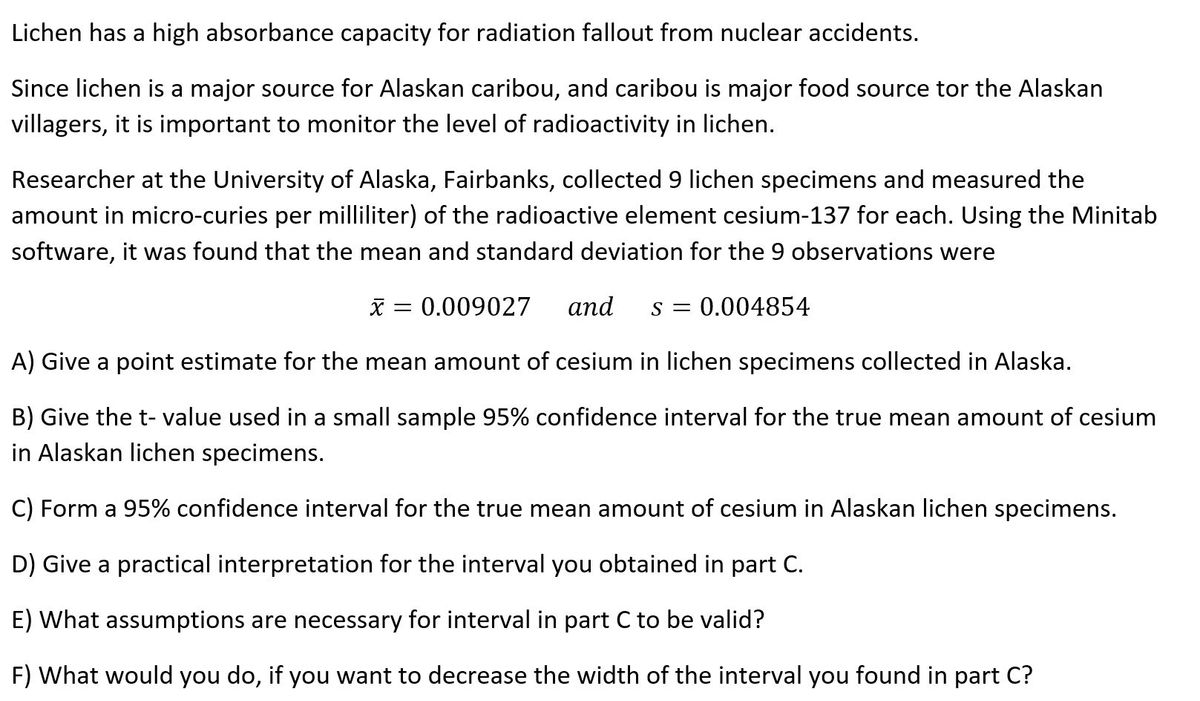

Transcribed Image Text:Lichen has a high absorbance capacity for radiation fallout from nuclear accidents.
Since lichen is a major source for Alaskan caribou, and caribou is major food source tor the Alaskan
villagers, it is important to monitor the level of radioactivity in lichen.
Researcher at the University of Alaska, Fairbanks, collected 9 lichen specimens and measured the
amount in micro-curies per milliliter) of the radioactive element cesium-137 for each. Using the Minitab
software, it was found that the mean and standard deviation for the 9 observations were
X = 0.009027
аnd
s = 0.004854
A) Give a point estimate for the mean amount of cesium in lichen specimens collected in Alaska.
B) Give the t- value used in a small sample 95% confidence interval for the true mean amount of cesium
in Alaskan lichen specimens.
C) Form a 95% confidence interval for the true mean amount of cesium in Alaskan lichen specimens.
D) Give a practical interpretation for the interval you obtained in part C.
E) What assumptions are necessary for interval in part C to be valid?
F) What would you do, if you want to decrease the width of the interval you found in part C?
Expert Solution
This question has been solved!
Explore an expertly crafted, step-by-step solution for a thorough understanding of key concepts.

This is a popular solution

Trending nowThis is a popular solution!

Step by stepSolved in 4 steps with 1 images

Knowledge Booster


Learn more about
Need a deep-dive on the concept behind this application? Look no further. Learn more about this topic, statistics and related others by exploring similar questions and additional content below.Similar questions
- 4.arrow_forwardThe Derbyshire village of Eyam, England, suffered an outbreak of bubonic plague in 1665–1666. The source of that plague was believed to be the Great Plague of London. The village is best known for being the "plague village" that chose to iso- late itself when the plague was discovered there in August 1665 rather than let the infection spread. Detailed records were preserved. The initial population of Eyam was 350. In mid-May 1666, nine months after the beginning of the epidemic, there were 254 susceptibles and 7 infectives. The data about the epidemic in the remain- ing months are given in Table 2.2. The infective period of the bubonic plague is 11 days. (a) Estimate a (b) Use the implicit solution of the SIR model to estimate B.arrow_forwardAccording to a report from the United States Environmental Protection Agency, burning one gallon of gasoline typically emits about 8.9 kg of CO2. A fuel company wants to test a new type of gasoline designed to have lower CO2 emissions. Their hypotheses are Ho : µ = 8.9 kg and H, : µ < 8.9 kg. where u is the mean amount of CO, emitted by burning one gallon of this new gasoline. Suppose that Ho is actually true. Which situation below would have the lowest probability of a Type I error? Choose 1 answer: n = 20 and a = 0.01 n = 50 and a = 0.05 n = 75 and a = 0.10arrow_forward
- A pet food company is concerned that their pet food must have a certain % of the mineral 2Ine II the food. Too little and dogs get very sick. If the machinery is working correctly, the average zinc is µu = .375 gram/lb of food. They sample 25 bags of food and find: x = .359 grams o = .05 grams The firm wants to know if their pet food is healthy. They decide on a 95% level of significance. Do the Z test. They ask you to perform the analysis. a) State the null and alternative hypotheses. Ho: На: b) Draw a picture/graph of what you are trying to find. c) Find the critical value you will use. d) Compute the test statistic (from the data) e) What do you conclude? Why?arrow_forwardBurning fuels in power plants and motor vehicles emits carbon dioxide (CO2), which contributes to global warming. The CO2 emissions (metric tons per capita) for countries varies from 0.02 in Burundi to 44.02 in Qatar. Although the data set includes 214 countries, the CO2 emissions of 15 countries are not available on the World Bank database. The data set is too large to display but the data for the first five countries is given. Use the full data set with data on the 214 countries to answer the questions. To access the complete data set, click the link for your preferred software format: Excel Minitab JMP SPSS TI R Mac-TXT PC-TXT CSV Crunchlt! Country CO2 Emissions (Metric Tons per Capita) Aruba 23.92 Andorra 5.97 Afghanistan 0.43 Angola 1.35 Albania 1.61 Find the mean and the median for the full data set. Round your answers to three decimal places. The mean for these data is tons per person The median for these data is tons per personarrow_forwardAn article in the San Jose Mercury News stated that students in the California state university system take 4.5 years, on average, to finish their undergraduate degrees. Dr. Lewis believes the mean time for students at Clayton State University is longer than this average. A survey of 49 graduates from Clayton State had a mean time of 5.1 years to complete their Bachelor's degree, with a sample standard deviation of 1.2 years. Correctly identify the null and alternative hypotheses for this study:arrow_forward
- The differential is a standard measurement made during a blood test. It consists of classifying white blood cells into the following five categories: (1) basophils, (2) eosinophils, (3) monocytes, (4) lymphocytes, and (5) neutrophils. The usual practice is to look at 100 randomly selected cells under a microscope and to count the number of cells within each of the five categories. Assume that a normal adult will have the following proportions of cells in each category: basophils, 0.5%; eosinophils, 1.5%; monocytes, 4%; lym- phocytes, 34%; and neutrophils, 60%. *5.25 An excess of eosinophils is sometimes consistent with a violent allergic reaction. What is the exact probability that a normal adult will have 5 or more eosinophils? *5.26 An excess of lymphocytes is consistent with vari- ous forms of viral infection, such as hepatitis. What is the probability that a normal adult will have 40 or more lymphocytes? *5.27 What is the probability a normal adult will have 50 or more lymphocytes?arrow_forwardAn article published by the American Meteorological Society, gives a rating system used to classify Nor'easter storms that frequently hit New England which often cause havoc near the ocean. A severe storm has an average peak wave height of μ=16.4μ feet for waves near the shore. Suppose that a Nor'easter is in progress at the severe storm class rating. Peak wave heights are usually measured from land off piers. Suppose that a reading of 32 waves showed an average wave height of x¯=14.3 feet. Previous reports of severe storms indicate that σ=3.5 feet. Does this information suggest that the storm is decreasing below the severe rating? Use α=0.01 to test the claim.What is the level of significance? State the null and alternate hypotheses. H0:H0:? p σ μ χ Select an answer < = ≠ > H1:H1:? μ p χ σ Select an answer ≠ > = <arrow_forwardThe sulfate ion concentration in natural water can be determined by measuring the turbidity that results when an excess of BaCl2 is added to a measured quantity of the sample. A turbiditimeter, the instrument used for this analysis, was calibrated with a series of standard Na2SO4 solutions. The following data were obtained for the calibration:arrow_forward
- According to Figure 22.2, on which country other than Canada does the United States have the largest impact? Why do you think that this is so?arrow_forwardThe article refered to in Exercise 1 also considered the effect of gypsum on the electric conductivity (in dS m) of soil. Two types of soil were each treated with three different amounts of gypsum, with two replicates for each soil-gypsum combination. The data are presented in the following table. Soil Type Gypsum (g/kg) Las Animas Madera 0.00 1.52 1.05 1.01 0.92 0.27 1.49 0.91 1.12 0.92 0.46 0.9 0.92 0.88 0.92 Is there convincing evidence of an interaction between the amount of gypsum and soil type? Can you conclude that the conductivity differs among the soil types? Can you conclude that the conductivity differs with the amount of gypsum added? C.arrow_forwardPlease answer part B and C. Thank Youarrow_forward
arrow_back_ios
SEE MORE QUESTIONS
arrow_forward_ios
Recommended textbooks for you
- MATLAB: An Introduction with ApplicationsStatisticsISBN:9781119256830Author:Amos GilatPublisher:John Wiley & Sons Inc
 Probability and Statistics for Engineering and th...StatisticsISBN:9781305251809Author:Jay L. DevorePublisher:Cengage Learning
 Statistics for The Behavioral Sciences (MindTap C...StatisticsISBN:9781305504912Author:Frederick J Gravetter, Larry B. WallnauPublisher:Cengage Learning
  Elementary Statistics: Picturing the World (7th E...StatisticsISBN:9780134683416Author:Ron Larson, Betsy FarberPublisher:PEARSON
 The Basic Practice of StatisticsStatisticsISBN:9781319042578Author:David S. Moore, William I. Notz, Michael A. FlignerPublisher:W. H. Freeman
 Introduction to the Practice of StatisticsStatisticsISBN:9781319013387Author:David S. Moore, George P. McCabe, Bruce A. CraigPublisher:W. H. Freeman
MATLAB: An Introduction with Applications
Statistics
ISBN:9781119256830
Author:Amos Gilat
Publisher:John Wiley & Sons Inc
Probability and Statistics for Engineering and th...
Statistics
ISBN:9781305251809
Author:Jay L. Devore
Publisher:Cengage Learning
Statistics for The Behavioral Sciences (MindTap C...
Statistics
ISBN:9781305504912
Author:Frederick J Gravetter, Larry B. Wallnau
Publisher:Cengage Learning
Elementary Statistics: Picturing the World (7th E...
Statistics
ISBN:9780134683416
Author:Ron Larson, Betsy Farber
Publisher:PEARSON
The Basic Practice of Statistics
Statistics
ISBN:9781319042578
Author:David S. Moore, William I. Notz, Michael A. Fligner
Publisher:W. H. Freeman
Introduction to the Practice of Statistics
Statistics
ISBN:9781319013387
Author:David S. Moore, George P. McCabe, Bruce A. Craig
Publisher:W. H. Freeman