
Statistics: The Art and Science of Learning from Data (4th Edition)
4th Edition
ISBN: 9780321997838
Author: Alan Agresti, Christine A. Franklin, Bernhard Klingenberg
Publisher: PEARSON
expand_more
expand_more
format_list_bulleted
Concept explainers
Videos
Textbook Question
Chapter 3, Problem 85CP
Murder and single-parent families For Table 3.6 on the 50 states and D.C., the figure below shows the relationship between the murder rate and the percentage of single-parent families.
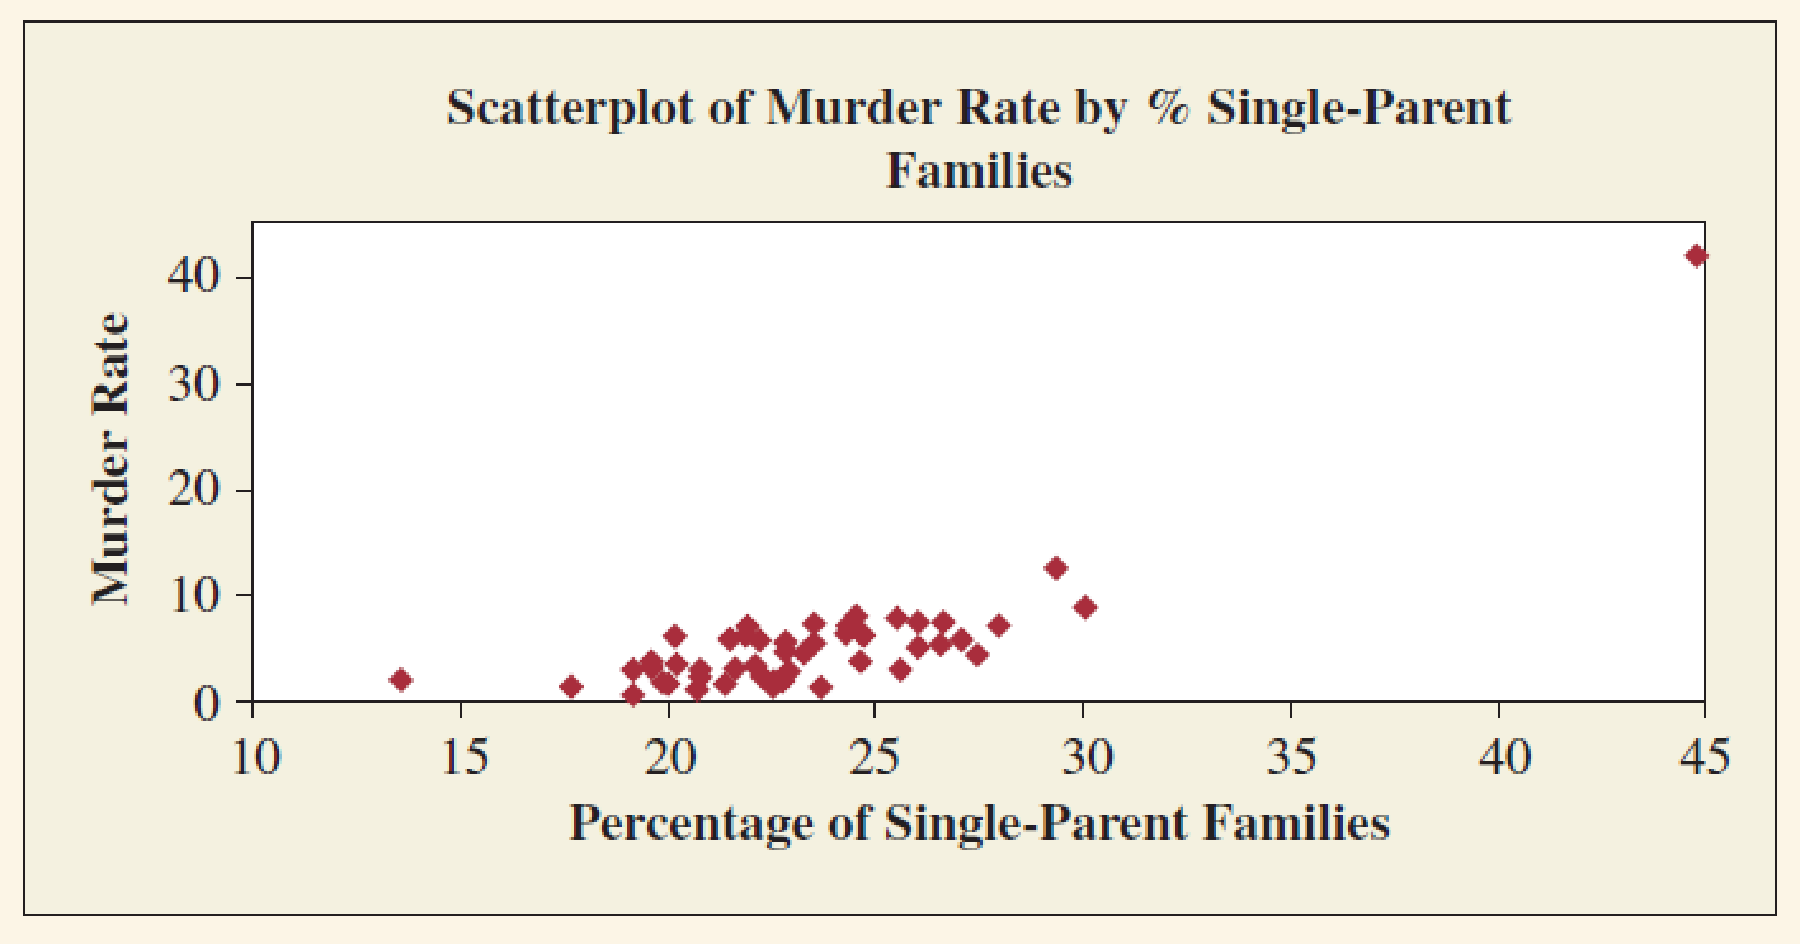
- a. For D.C., the percentage of single-parent families = 44.7 and the murder rate = 41.8. Identify D.C. on the
scatterplot and explain the effect you would expect it to have on aregression analysis . - b. The regression line fitted to all 51 observations is ŷ = −21.4 + 1.14x. The regression line fitted only to the 50 states is ŷ = −8.2 + 0.56x. Summarize the effect of including D.C. in the analysis.
Expert Solution & Answer
Want to see the full answer?
Check out a sample textbook solution
Students have asked these similar questions
«
CENGAGE MINDTAP
Quiz: Chapter 38
Assignment: Quiz: Chapter 38
ips
Questions ra1kw08h_ch38.15m
13.
14.
15.
O
Which sentence has modifiers in the correct place?
O a. When called, she for a medical emergency responds quickly.
b. Without giving away too much of the plot, Helena described the heroine's actions in the film.
O c. Nearly the snakebite victim died before the proper antitoxin was injected.
. O
O
16
16.
O
17.
18.
O
19.
O
20
20.
21
21.
22.
22
DS
23.
23
24.
25.
O
O
O
Questions ra1kw08h_ch36.14m
12.
13.
14.
15.
16.
Ӧ
17.
18.
19.
OS
20.
Two separate sentences need
Oa. two separate subjects.
Ob. two dependent clauses.
c. one shared subject.
Customers experiencing technical difficulty with their Internet cable service may call an 800 number for technical support. It takes the technician between 30 seconds and 11 minutes to resolve the problem. The distribution of this support time follows the uniform distribution.
Required:
a. What are the values for a and b in minutes?
Note: Do not round your intermediate calculations. Round your answers to 1 decimal place.
b-1. What is the mean time to resolve the problem?
b-2. What is the standard deviation of the time?
c. What percent of the problems take more than 5 minutes to resolve?
d. Suppose we wish to find the middle 50% of the problem-solving times. What are the end points of these two times?
Chapter 3 Solutions
Statistics: The Art and Science of Learning from Data (4th Edition)
Ch. 3.1 - Which is the response/explanatory variable? For...Ch. 3.1 - Sales and advertising Each month, the owner of...Ch. 3.1 - Does higher income make you happy? Every General...Ch. 3.1 - Diamonds The clarity and cut of a diamond are two...Ch. 3.1 - Alcohol and college students The Harvard School of...Ch. 3.1 - How to fight terrorism? A survey of 1000 adult...Ch. 3.1 - Heaven and hell Two questions on the General...Ch. 3.1 - Prob. 8PBCh. 3.1 - Gender gap in party ID In recent election years,...Ch. 3.1 - Use the GSS Go to the GSS website...
Ch. 3.2 - Used cars and direction of association For the 100...Ch. 3.2 - Broadband and GDP The Internet Use data file on...Ch. 3.2 - Prob. 13PBCh. 3.2 - Politics and newspaper reading For the FL Student...Ch. 3.2 - Prob. 15PBCh. 3.2 - Match the scatterplot with r Match the following...Ch. 3.2 - Prob. 17PBCh. 3.2 - Prob. 18PBCh. 3.2 - Prob. 19PBCh. 3.2 - Prob. 20PBCh. 3.2 - Prob. 21PBCh. 3.2 - Prob. 22PBCh. 3.2 - Prob. 23PBCh. 3.3 - Sketch plots of lines Identify the values of the...Ch. 3.3 - Prob. 25PBCh. 3.3 - Home selling prices The House Selling Prices FL...Ch. 3.3 - Prob. 27PBCh. 3.3 - Prob. 28PBCh. 3.3 - Prob. 29PBCh. 3.3 - Broadband subscribers and population The Internet...Ch. 3.3 - Prob. 31PBCh. 3.3 - Prob. 32PBCh. 3.3 - Regression between cereal sodium and sugar The...Ch. 3.3 - Prob. 34PBCh. 3.3 - Advertising and sales Each month, the owner of...Ch. 3.3 - Midtermfinal correlation For students who take...Ch. 3.3 - Predict final exam from midterm In an introductory...Ch. 3.3 - NL baseball Example 9 related y = team scoring...Ch. 3.3 - Study time and college GPA A graduate teaching...Ch. 3.3 - Oil and GDP An article in the September 16, 2006,...Ch. 3.3 - Mountain bikes revisited Is there a relationship...Ch. 3.3 - Mountain bike and suspension type Refer to the...Ch. 3.3 - Fuel Consumption Most cars are fuel efficient when...Ch. 3.4 - Extrapolating murder The SPSS figure shows the...Ch. 3.4 - Mens Olympic long jumps The Olympic winning mens...Ch. 3.4 - U.S. average annual temperatures Use the U.S....Ch. 3.4 - Murder and education Example 13 found the...Ch. 3.4 - Murder and poverty For Table 3.6, the regression...Ch. 3.4 - TV watching and the birth rate The figure shows...Ch. 3.4 - Looking for outliers Using software, analyze the...Ch. 3.4 - Regression between cereal sodium and sugar Let x =...Ch. 3.4 - Gestational period and life expectancy Does the...Ch. 3.4 - Antidrug campaigns An Associated Press story (June...Ch. 3.4 - Whats wrong with regression? Explain whats wrong...Ch. 3.4 - Education causes crime? The table shows a small...Ch. 3.4 - Death penalty and race The table shows results of...Ch. 3.4 - NAEP scores Eighth-grade math scores on the...Ch. 3.4 - Age a confounder? A study observes that the...Ch. 3 - Choose explanatory and response For the following...Ch. 3 - Graphing data For each case in the previous...Ch. 3 - Life after death for males and females In a recent...Ch. 3 - God and happiness Go to the GSS website...Ch. 3 - Degrees and income The mean annual salaries earned...Ch. 3 - Bacteria in ground turkey Consumer Reports...Ch. 3 - Women managers in the work force The following...Ch. 3 - RateMyProfessor.com The website RateMyProfessors....Ch. 3 - Women in government and economic life The OECD...Ch. 3 - African droughts and dust Is there a relationship...Ch. 3 - Crime rate and urbanization For the data in...Ch. 3 - Gestational period and life expectancy revisited...Ch. 3 - Height and paycheck The headline of an article in...Ch. 3 - Predicting college GPA An admissions officer...Ch. 3 - College GPA = high school GPA Refer to the...Ch. 3 - Whats a college degree worth? In 2002, a census...Ch. 3 - Care Weight and gas hogs: The table shows a short...Ch. 3 - Predicting Internet use from cell phone use We now...Ch. 3 - Income depends on education? For a study of...Ch. 3 - Fertility and GDP Refer to the Human Development...Ch. 3 - Women working and birth rate Using data from...Ch. 3 - Education and income The regression equation for a...Ch. 3 - Income in euros Refer to the previous exercise....Ch. 3 - Changing units for cereal data Refer to the Cereal...Ch. 3 - Murder and single-parent families For Table 3.6 on...Ch. 3 - Violent crime and college education For the U.S....Ch. 3 - Violent crime and high school education Repeat the...Ch. 3 - Crime and urbanization For the U.S. Statewide...Ch. 3 - High school graduation rates and health insurance...Ch. 3 - Womens Olympic high jumps Example 11 discussed how...Ch. 3 - Income and height A survey of adults revealed a...Ch. 3 - More TV watching goes with fewer babies? For...Ch. 3 - More sleep causes death? An Associated Press story...Ch. 3 - Ask Marilyn Marilyn vos Savant writes a column for...Ch. 3 - Time studying and GPA Is there a relationship...Ch. 3 - Warming in Newnan, Georgia Access the Newnan GA...Ch. 3 - Fluoride and AIDS An Associated Press story...Ch. 3 - Fish fights Alzheimers An AP story (July 22, 2003)...Ch. 3 - Dogs make you healthier A study published in the...Ch. 3 - Multiple choice: Correlate GPA and GRE In a study...Ch. 3 - Multiple choice: Properties of r Which of the...Ch. 3 - Multiple choice: Interpreting r One can interpret...Ch. 3 - Multiple choice: Correct statement about r Which...Ch. 3 - Multiple choice: Describing association between...Ch. 3 - Multiple choice: Slope and correlation The slope...Ch. 3 - Multiple choice: Interpretation of r2 An r2...Ch. 3 - True or false The variables y = annual income...Ch. 3 - Correlation doesnt depend on units Suppose you...Ch. 3 - When correlation = slope Consider the formula...Ch. 3 - Center of the data Consider the formula a=ybx for...Ch. 3 - Final exam regresses toward mean of midterm Let y...Ch. 3 - Activity: Guess the correlation The Guess the...
Knowledge Booster


Learn more about
Need a deep-dive on the concept behind this application? Look no further. Learn more about this topic, statistics and related others by exploring similar questions and additional content below.Similar questions
- Exercise 6-6 (Algo) (LO6-3) The director of admissions at Kinzua University in Nova Scotia estimated the distribution of student admissions for the fall semester on the basis of past experience. Admissions Probability 1,100 0.5 1,400 0.4 1,300 0.1 Click here for the Excel Data File Required: What is the expected number of admissions for the fall semester? Compute the variance and the standard deviation of the number of admissions. Note: Round your standard deviation to 2 decimal places.arrow_forward1. Find the mean of the x-values (x-bar) and the mean of the y-values (y-bar) and write/label each here: 2. Label the second row in the table using proper notation; then, complete the table. In the fifth and sixth columns, show the 'products' of what you're multiplying, as well as the answers. X y x minus x-bar y minus y-bar (x minus x-bar)(y minus y-bar) (x minus x-bar)^2 xy 16 20 34 4-2 5 2 3. Write the sums that represents Sxx and Sxy in the table, at the bottom of their respective columns. 4. Find the slope of the Regression line: bi = (simplify your answer) 5. Find the y-intercept of the Regression line, and then write the equation of the Regression line. Show your work. Then, BOX your final answer. Express your line as "y-hat equals...arrow_forwardApply STATA commands & submit the output for each question only when indicated below i. Generate the log of birthweight and family income of children. Name these new variables Ibwght & Ifaminc. Include the output of this code. ii. Apply the command sum with the detail option to the variable faminc. Note: you should find the 25th percentile value, the 50th percentile and the 75th percentile value of faminc from the output - you will need it to answer the next question Include the output of this code. iii. iv. Use the output from part ii of this question to Generate a variable called "high_faminc" that takes a value 1 if faminc is less than or equal to the 25th percentile, it takes the value 2 if faminc is greater than 25th percentile but less than or equal to the 50th percentile, it takes the value 3 if faminc is greater than 50th percentile but less than or equal to the 75th percentile, it takes the value 4 if faminc is greater than the 75th percentile. Include the outcome of this code…arrow_forward
- solve this on paperarrow_forwardApply STATA commands & submit the output for each question only when indicated below i. Apply the command egen to create a variable called "wyd" which is the rowtotal function on variables bwght & faminc. ii. Apply the list command for the first 10 observations to show that the code in part i worked. Include the outcome of this code iii. Apply the egen command to create a new variable called "bwghtsum" using the sum function on variable bwght by the variable high_faminc (Note: need to apply the bysort' statement) iv. Apply the "by high_faminc" statement to find the V. descriptive statistics of bwght and bwghtsum Include the output of this code. Why is there a difference between the standard deviations of bwght and bwghtsum from part iv of this question?arrow_forwardAccording to a health information website, the distribution of adults’ diastolic blood pressure (in millimeters of mercury, mmHg) can be modeled by a normal distribution with mean 70 mmHg and standard deviation 20 mmHg. b. Above what diastolic pressure would classify someone in the highest 1% of blood pressures? Show all calculations used.arrow_forward
- Write STATA codes which will generate the outcomes in the questions & submit the output for each question only when indicated below i. ii. iii. iv. V. Write a code which will allow STATA to go to your favorite folder to access your files. Load the birthweight1.dta dataset from your favorite folder and save it under a different filename to protect data integrity. Call the new dataset babywt.dta (make sure to use the replace option). Verify that it contains 2,998 observations and 8 variables. Include the output of this code. Are there missing observations for variable(s) for the variables called bwght, faminc, cigs? How would you know? (You may use more than one code to show your answer(s)) Include the output of your code (s). Write the definitions of these variables: bwght, faminc, male, white, motheduc,cigs; which of these variables are categorical? [Hint: use the labels of the variables & the browse command] Who is this dataset about? Who can use this dataset to answer what kind of…arrow_forwardApply STATA commands & submit the output for each question only when indicated below İ. ii. iii. iv. V. Apply the command summarize on variables bwght and faminc. What is the average birthweight of babies and family income of the respondents? Include the output of this code. Apply the tab command on the variable called male. How many of the babies and what share of babies are male? Include the output of this code. Find the summary statistics (i.e. use the sum command) of the variables bwght and faminc if the babies are white. Include the output of this code. Find the summary statistics (i.e. use the sum command) of the variables bwght and faminc if the babies are male but not white. Include the output of this code. Using your answers to previous subparts of this question: What is the difference between the average birthweight of a baby who is male and a baby who is male but not white? What can you say anything about the difference in family income of the babies that are male and male…arrow_forwardA public health researcher is studying the impacts of nudge marketing techniques on shoppers vegetablesarrow_forward
- The director of admissions at Kinzua University in Nova Scotia estimated the distribution of student admissions for the fall semester on the basis of past experience. Admissions Probability 1,100 0.5 1,400 0.4 1,300 0.1 Click here for the Excel Data File Required: What is the expected number of admissions for the fall semester? Compute the variance and the standard deviation of the number of admissions. Note: Round your standard deviation to 2 decimal places.arrow_forwardA pollster randomly selected four of 10 available people. Required: How many different groups of 4 are possible? What is the probability that a person is a member of a group? Note: Round your answer to 3 decimal places.arrow_forwardWind Mountain is an archaeological study area located in southwestern New Mexico. Potsherds are broken pieces of prehistoric Native American clay vessels. One type of painted ceramic vessel is called Mimbres classic black-on-white. At three different sites the number of such sherds was counted in local dwelling excavations. Test given. Site I Site II Site III 63 19 60 43 34 21 23 49 51 48 11 15 16 46 26 20 31 Find .arrow_forward
arrow_back_ios
SEE MORE QUESTIONS
arrow_forward_ios
Recommended textbooks for you
 Glencoe Algebra 1, Student Edition, 9780079039897...AlgebraISBN:9780079039897Author:CarterPublisher:McGraw Hill
 Functions and Change: A Modeling Approach to Coll...AlgebraISBN:9781337111348Author:Bruce Crauder, Benny Evans, Alan NoellPublisher:Cengage Learning
 Big Ideas Math A Bridge To Success Algebra 1: Stu...AlgebraISBN:9781680331141Author:HOUGHTON MIFFLIN HARCOURTPublisher:Houghton Mifflin Harcourt
 Algebra and Trigonometry (MindTap Course List)AlgebraISBN:9781305071742Author:James Stewart, Lothar Redlin, Saleem WatsonPublisher:Cengage Learning
 College AlgebraAlgebraISBN:9781305115545Author:James Stewart, Lothar Redlin, Saleem WatsonPublisher:Cengage Learning
 Holt Mcdougal Larson Pre-algebra: Student Edition...AlgebraISBN:9780547587776Author:HOLT MCDOUGALPublisher:HOLT MCDOUGAL
Glencoe Algebra 1, Student Edition, 9780079039897...
Algebra
ISBN:9780079039897
Author:Carter
Publisher:McGraw Hill
Functions and Change: A Modeling Approach to Coll...
Algebra
ISBN:9781337111348
Author:Bruce Crauder, Benny Evans, Alan Noell
Publisher:Cengage Learning
Big Ideas Math A Bridge To Success Algebra 1: Stu...
Algebra
ISBN:9781680331141
Author:HOUGHTON MIFFLIN HARCOURT
Publisher:Houghton Mifflin Harcourt
Algebra and Trigonometry (MindTap Course List)
Algebra
ISBN:9781305071742
Author:James Stewart, Lothar Redlin, Saleem Watson
Publisher:Cengage Learning
College Algebra
Algebra
ISBN:9781305115545
Author:James Stewart, Lothar Redlin, Saleem Watson
Publisher:Cengage Learning
Holt Mcdougal Larson Pre-algebra: Student Edition...
Algebra
ISBN:9780547587776
Author:HOLT MCDOUGAL
Publisher:HOLT MCDOUGAL
Correlation Vs Regression: Difference Between them with definition & Comparison Chart; Author: Key Differences;https://www.youtube.com/watch?v=Ou2QGSJVd0U;License: Standard YouTube License, CC-BY
Correlation and Regression: Concepts with Illustrative examples; Author: LEARN & APPLY : Lean and Six Sigma;https://www.youtube.com/watch?v=xTpHD5WLuoA;License: Standard YouTube License, CC-BY