
Concept explainers
Videos
The average waiting time for a patient at an El Paso physician's office is just over 29 minutes, well above the national average of 21 minutes. In fact, El Paso has the longest physician's office waiting times in the United States (El Paso Times, January 8, 2012). In order to address the issue of long patient wait times, some physician's offices are using wait tracking systems to notify patients of expected wait times. Patients can adjust their arrival times based on this formation and spend less time in waiting rooms. The following data show wait times (minutes) for a sample of patients at offices that do not have an office tracking system and wait times for a sample of patients at offices with an office tracking system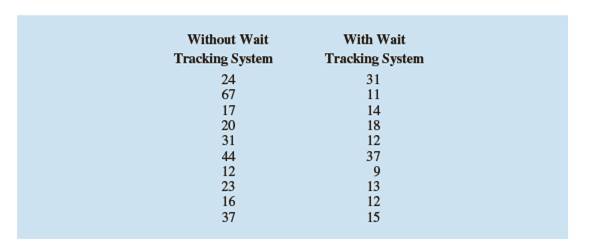
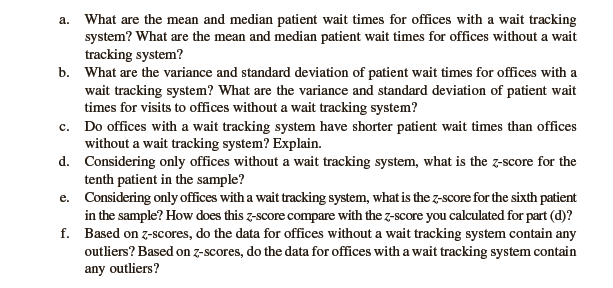
a.What are the
b.What are the variance and standard deviation of patient wait times for offices with a wait tracking system? What are the variance and standard deviation of patient wait times for visits to offices without a wait tracking system?
c.Do offices with a wait tracking system have shorter patient wait times than offices without a wait tracking system? Explain.
d.Considering only offices without a wait tracking system, what is the z-score for the tenth patient in the sample?
e.Considering only offices with a wait tracking system, what is the z-score for the sixth patient in the sample? How does this z-score compare with the z-score you calculated for pat (d)?
f.Based on z-scores, do the data for offices without a wait tracking system contain any outliers? Based on z-scores, do the data for offices with a wait tracking system contain any outliers?
Want to see the full answer?
Check out a sample textbook solution
Chapter 3 Solutions
Essentials of Modern Business Statistics with Microsoft Office Excel (Book Only)


- Several years ago, the Arcadia school system was criticized because the average Arcadia High School graduate could read at only the ninth-grade level. After this report was made, a special reading program was established to upgrade skills. The AHS principal wants to know if the reading program worked. If it has, he will request that an accreditation team visit the school. If the program has not improved the reading level to at least 10.0 (sophomore level), the administrator would like to avoid the embarrassment of a poor review. To determine the average reading level of the senior class, we select ten seniors at random. We assume that reading scores are normally distributed. The reading scores for the ten seniors are shown in Table 1. Table 1: Reading Scores for Sample High School Seniors Student Reading Score 1 13.4 2 12.1 3 11.4 4 10.6 5 10.3 6 10.2 7 9.8 8 9.7 9 9.4 10 8.6 Assuming the sample standard…arrow_forwardSeveral years ago, the Arcadia school system was criticized because the average Arcadia High School graduate could read at only the ninth-grade level. After this report was made, a special reading program was established to upgrade skills. The AHS principal wants to know if the reading program worked. If it has, he will request that an accreditation team visit the school. If the program has not improved the reading level to at least 10.0 (sophomore level), the administrator would like to avoid the embarrassment of a poor review. To determine the average reading level of the senior class, we select ten seniors at random. We assume that reading scores are normally distributed. The reading scores for the ten seniors are shown in Table 1. Table 1: Reading Scores for Sample High School Seniors Student Reading Score 1 13.4 2 12.1 3 11.4 4 10.6 5 10.3 6 10.2 7 9.8 8 9.7 9 9.4 10 8.6 Assuming the sample…arrow_forwardYou may need to use the appropriate appendix table to answer this question. Alexa is the popular virtual assistant developed by Amazon. Alexa interacts with users using artificial intelligence and voice recognition. It can be used to perform daily tasks such as making to-do lists, reporting the news and weather, and interacting with other smart devices in the home. In 2018, the Amazon Alexa app was downloaded some 2,800 times per day from the Google Play store.† Assume that the number of downloads per day of the Amazon Alexa app is normally distributed with a mean of 2,800 and standard deviation of 860. (a) What is the probability there are 1,900 or fewer downloads of Amazon Alexa in a day? (Round your answer to four decimal places.) (b) What is the probability there are between 1,400 and 2,600 downloads of Amazon Alexa in a day? (Round your answer to four decimal places.) (c) What is the probability there are more than 3,100 downloads of Amazon Alexa in a day? (Round…arrow_forward
- Several years ago, the Arcadia school system was criticized because the average Arcadia High School graduate could read at only the ninth-grade level. After this report was made, a special reading program was established to upgrade skills. The AHS principal wants to know if the reading program worked. If it has, he will request that an accreditation team visit the school. If the program has not improved the reading level to at least 10.0 (sophomore level), the administrator would like to avoid the embarrassment of a poor review. To determine the average reading level of the senior class, we select ten seniors at random. We assume that reading scores are normally distributed. The reading scores for the ten seniors are shown in Table 1. Table 1: Reading Scores for Sample High School Seniors Student Reading Score 1 13.4 2 12.1 3 11.4 4 10.6 5 10.3 6 10.2 7 9.8 8 9.7 9 9.4 10 8.6 Calculate the sample mean ()…arrow_forwardYou may need to use the appropriate appendix table to answer this question. Alexa is the popular virtual assistant developed by Amazon. Alexa interacts with users using artificial intelligence and voice recognition. It can be used to perform daily tasks such as making to-do lists, reporting the news and weather, and interacting with other smart devices in the home. In 2018, the Amazon Alexa app was downloaded some 2,800 times per day from the Google Play store.† Assume that the number of downloads per day of the Amazon Alexa app is normally distributed with a mean of 2,800 and standard deviation of 860. (a) What is the probability there are 1,900 or fewer downloads of Amazon Alexa in a day? (Round your answer to four decimal places.) (b) What is the probability there are between 1,600 and 2,400 downloads of Amazon Alexa in a day? (Round your answer to four decimal places.) (c) What is the probability there are more than 2,900 downloads of Amazon Alexa in a day? (Round…arrow_forwardYou may need to use the appropriate appendix table to answer this question. Alexa is the popular virtual assistant developed by Amazon. Alexa interacts with users using artificial intelligence and voice recognition. It can be used to perform daily tasks such as making to-do lists, reporting the news and weather, and interacting with other smart devices in the home. In 2018, the Amazon Alexa app was downloaded some 2,800 times per day from the Google Play store.† Assume that the number of downloads per day of the Amazon Alexa app is normally distributed with a mean of 2,800 and standard deviation of 860.arrow_forward
- You may need to use the appropriate appendix table or technology to answer this question. Advertisers contract with internet service providers and search engines to place ads on websites. They pay a fee based on the number of potential customers who click on their ad. Unforțunately, click fraud-the practice of someone clicking on an ad solely for the purpose of driving up advertising revenue–has become a problem. Businessweek reports that 4C percent of advertisers claim they have been a victim of click fraud. Suppose a simple random sample of 390 advertisers will be taken to learn more about how they are affected by this practice. (Round your answers to four decimal places.) (a) What is the probability that the sample proportion will be within ±0.04 of the population proportion experiencing click fraud? (b) What is the probability that the sample proportion will be greater than 0.45?arrow_forwardSuppose you run a non-for-profit organization focused to keeping national parks free of litter. Crucial to getting donations to your non-for-profit is email advertising. One way to measure the success of your email advertising is to measure the amount of money coming from links to donate on your emails. Normally, your emails contain only words and numbers about litter in national parks. You believe that including images of littered areas of national parks might increase the amount in donations that you get through emails. To test if this is true, you randomly assign 50 individuals to receive the new email format with images and 42 to receive your usual email format (this is called an A/B test). The new email format had an average donation per recipient of $5.50 with a standard deviation of $2.75 while the old email format had an average donation per recipient of $3.50 with a standard deviation of $2.50. Does the average donation differ between the new and old email formats? Let µi be…arrow_forwardSuppose you run a non-for-profit organization focused to keeping national parks free of litter. Crucial to getting donations to your non-for-profit is email advertising. One way to measure the success of your email advertising is to measure the amount of money coming from links to donate on your emails. Normally, your emails contain only words and numbers about litter in national parks. You believe that including images of littered areas of national parks might increase the amount in donations that you get through emails. To test if this is true, you randomly assign 50 individuals to receive the new email format with images and 42 to receive your usual email format (this is called an A/B test). The new email format had an average donation per recipient of $5.50 with a standard deviation of $2.75 while the old email format had an average donation per recipient of $3.50 with a standard deviation of $2.50. Does the average donation differ between the new and old email formats? Let μ1 be…arrow_forward
- Suppose you run a non-for-profit organization focused to keeping national parks free of litter. Crucial to getting donations to your non-for-profit is email advertising. One way to measure the success of your email advertising is to measure the amount of money coming from links to donate on your emails. Normally, your emails contain only words and numbers about litter in national parks. You believe that including images of littered areas of national parks might increase the amount in donations that you get through emails. To test if this is true, you randomly assign 50 individuals to receive the new email format with images and 42 to receive your usual email format (this is called an A/B test). The new email format had an average donation per recipient of $5.50 with a standard deviation of $2.75 while the old email format had an average donation per recipient of $3.50 with a standard deviation of $2.50. Does the average donation differ between the new and old email formats? Let μ1 be…arrow_forwardSuppose you run a non-for-profit organization focused to keeping national parks free of litter. Crucial to getting donations to your non-for-profit is email advertising. One way to measure the success of your email advertising is to measure the amount of money coming from links to donate on your emails. Normally, your emails contain only words and numbers about litter in national parks. You believe that including images of littered areas of national parks might increase the amount in donations that you get through emails. To test if this is true, you randomly assign 50 individuals to receive the new email format with images and 42 to receive your usual email format (this is called an A/B test). The new email format had an average donation per recipient of$5.50 with a standard deviation of$2.75 while the old email format had an average donation per recipient of$3.50 with a standard deviation of$2.50. Does the average donation differ between the new and old email formats? Letμ1be the…arrow_forwardAn insurance company hires an actuary to determine whether the number of hours of safety drivingclasses can be used to predict the number of driving accidents for each driver. Identify theexplanatory variable, if any.arrow_forward
 MATLAB: An Introduction with ApplicationsStatisticsISBN:9781119256830Author:Amos GilatPublisher:John Wiley & Sons Inc
 Probability and Statistics for Engineering and th...StatisticsISBN:9781305251809Author:Jay L. DevorePublisher:Cengage Learning
 Statistics for The Behavioral Sciences (MindTap C...StatisticsISBN:9781305504912Author:Frederick J Gravetter, Larry B. WallnauPublisher:Cengage Learning
 Elementary Statistics: Picturing the World (7th E...StatisticsISBN:9780134683416Author:Ron Larson, Betsy FarberPublisher:PEARSON
 The Basic Practice of StatisticsStatisticsISBN:9781319042578Author:David S. Moore, William I. Notz, Michael A. FlignerPublisher:W. H. Freeman
 Introduction to the Practice of StatisticsStatisticsISBN:9781319013387Author:David S. Moore, George P. McCabe, Bruce A. CraigPublisher:W. H. Freeman