
Videos
Problem 2Motion Picture Industry
The motion picture industry is a competitive business. More than 50 studios produce several hundred new motion pictures each year, and the financial success of the motion pictures varies considerably. opening weekend gross the total the of
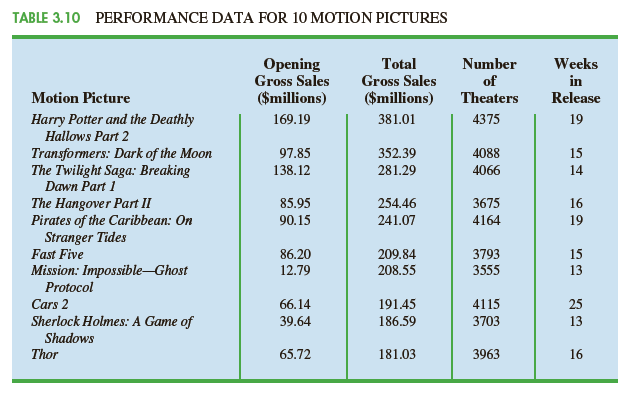 theaters the movie was shown in, and the number of weeks the motion picture was in release are common variables used to measure the success of a motion picture. Data on the top 100 grossing motion pictures released in 2011 (Box Office Mojo website, March 17, 2012) are contained in the DATAfile named 2011Movies. Table 3.10 shows the data for the first 10 motion pictures in this file. Note that some movies, such as War Horse, were released late in 2011 and continued to run in 2012.
Managerial Report
Use the numerical methods of descriptive statistics presented in this chapter to learn how these variables contribute to the success of a motion picture. Include the following in your report:
1. Descriptive statistics for each of the four variables along with a discussion of what the descriptive statistics tell us about the motion picture industry.
Want to see the full answer?
Check out a sample textbook solution
Chapter 3 Solutions
Essentials of Modern Business Statistics with Microsoft Office Excel (Book Only)


- Stock Market The week of September 15, 2008 was one of the most volatile weeks ever for the US stock market. The closing numbers of the Dow Jones Industrial Average each day were: What was the overall change for the week? Was it positive or negative?arrow_forwardLIFE SCIENCE APPLICATIONS HIV Infection The time interval between a persons initial infection with HIV and that persons eventual development of AIDS symptoms is an important issue. The method of infection with HIV affects the time interval before AIDS develops. One study of HIV patients who were infected by intravenous drug use found that 17 of the patients had AIDS after 4 years and 33 had developed the disease after 7 years. The relationship between the time interval and the percentage of patients with AIDS can be modeled accurately with a linear equation. Source: Epidemiologic Review. a. Write a linear equation y=mt+b that models these data, using the ordered pairs (4,0.17) and (7,0.33). b. Use your equation from part a to predict the number of years before half of these patients will have AIDS.arrow_forward
 Calculus For The Life SciencesCalculusISBN:9780321964038Author:GREENWELL, Raymond N., RITCHEY, Nathan P., Lial, Margaret L.Publisher:Pearson Addison Wesley,
 Glencoe Algebra 1, Student Edition, 9780079039897...AlgebraISBN:9780079039897Author:CarterPublisher:McGraw Hill
 Elementary AlgebraAlgebraISBN:9780998625713Author:Lynn Marecek, MaryAnne Anthony-SmithPublisher:OpenStax - Rice University
 Functions and Change: A Modeling Approach to Coll...AlgebraISBN:9781337111348Author:Bruce Crauder, Benny Evans, Alan NoellPublisher:Cengage Learning
 Holt Mcdougal Larson Pre-algebra: Student Edition...AlgebraISBN:9780547587776Author:HOLT MCDOUGALPublisher:HOLT MCDOUGAL
 Big Ideas Math A Bridge To Success Algebra 1: Stu...AlgebraISBN:9781680331141Author:HOUGHTON MIFFLIN HARCOURTPublisher:Houghton Mifflin Harcourt