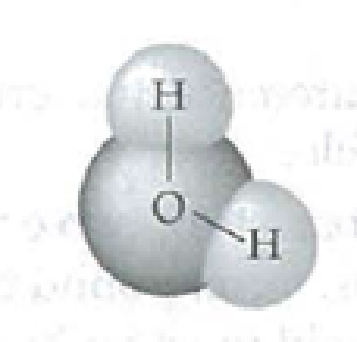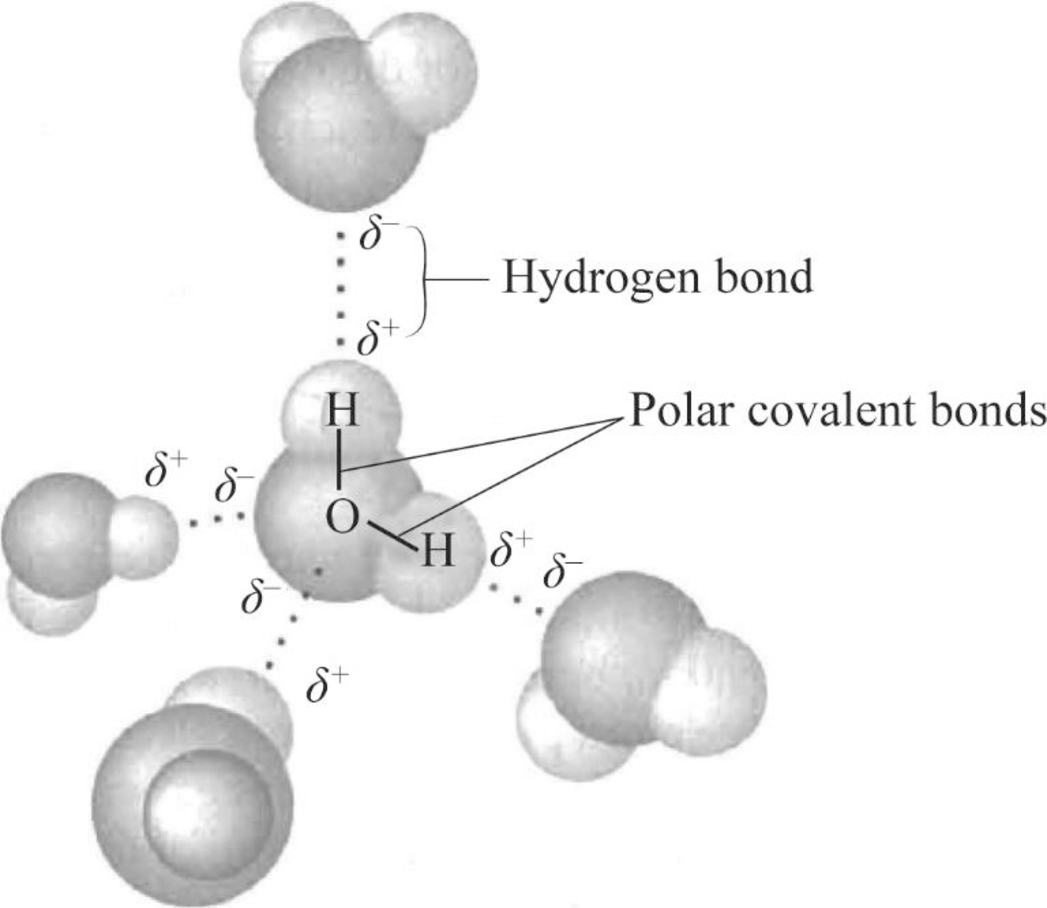
Draw the four water molecules that can hydrogen-bond to this water molecule. Label the bonds and the partial negative and positive charges that account for the formation of these hydrogen bonds.

To draw: The four water molecules that can form hydrogen-bond to the given water molecule and label the bonds and the partial negative and positive charges that account for the formation of these hydrogen bonds.
Introduction: A water molecule is shaped like a ‘V’ that consists of an oxygen atom and two hydrogen atoms. Oxygen is more electronegative than hydrogen. Thus, the shared electrons in the O-H covalent bond are more attracted by the oxygen atom.
Answer to Problem 1IQ
Pictorial representation: Fig.1 represents the four water molecules that can form hydrogen-bond for the given water molecule and label the bonds and the partial negative and positive charges that account for the formation of these hydrogen bonds.

Fig.1: Four water molecules bind with one water molecule
Explanation of Solution
Electronegativity is the tendency of an atom in a molecule to attract electrons shared in a covalent bond. If one atom is more electronegative, the electrons would be more on the side of that atom. Oxygen is more electronegative than hydrogen. In a water molecule, there are two polar covalent bonds between oxygen and hydrogen. Hence, there are two regions of partial negative charge on oxygen and a partial positive charge on each hydrogen atom.
The partial negatively charged oxygen atom of a water molecule is attracted to the partial positively charged hydrogen of the other water molecule. As per Fig.1, atoms on the partial charged regions can bind to oppositely charged regions on other adjoining water molecules. There are four regions of partial charge in a water molecule. Thus, the central water molecule can form a hydrogen bonds with four other water molecules.
Want to see more full solutions like this?
Chapter 3 Solutions
Study Guide for Campbell Biology
- a) The term “polylinker” in the pUC19 diagram is synonymous with what? b) Why should you never set your micropipette on the desk or otherwise turn it on its side? c) Describe the steps to use a 10 µL micropipe to draw and aliquot a 0.4 µL drop of water from a beaker of substrate into a microcentrifuge tube.arrow_forwarda) What is a silencer and how does it impact transcription? b) enhancers are proteins DNA regions Neither Both c) mediators are proteins DNA regions Neither Botharrow_forwardQUESTION 13 A cow recently fought off the tetanus bacterium. A serum of its antibodies was injected in me as a vaccine and allowed me to fight of the infection in my body. I stepped on a rusty nail recently. a. Natural passive immunity b. Artificial passive immunity c. Natural active immunity Od. Artificial active immunityarrow_forward
- QUESTION 4 In an effort to have a successful tissue transplant, the a. IgD antibodies Ob. IgG antibodies c. Human leukocyte antigens or MHC d. IgM antibodies of the recipient and the donor are matched.arrow_forwardOne of the gram negative bacilli we looked at in lab was Salmonella. Discuss two ways that Salmonella poisoning can occur and how it can be prevented. Do some research and discuss one food source that was recalled due to Salmonella contamination in the past five years.arrow_forward56% 1. In the lab report, where are tables and figures In the Results 2. What are the three types of graphs commonly articles? (3 points) Line graph Scatter Bar graph L s of experimental data placed? y used to present data in a lab report or scientific 3. The data in the table below show the average monthly temperatures (°F) in Baltimore, MD in 1915 and 2015. Year Jan Feb 1915 36 38 2015 Bar/Colum Mar Apr May Jun Jul Aug Sep Oct 3959+ 55 3125 40+ Nov Dec 62 7177 74 7260+ 6974 77 75 72 55% 51 49 47+ 35 Source: National Climatic Data Center (NCDC) - http://www.ncdc.noaa.gov/ a. Using the graph paper provided, plot a graph to present this data. Label all the axes and include all elements of the graph including a descriptive title. (8 points) No graph drawn b. What type of graph did you plot? Why did you choose this type of graph to present this data? (Hint: Is temperature a discrete or continuous data?) points) Ikyries -Darrow_forward
- t numbers of endangered Species in California's 4. The data in the table below show the percent coastal and inland waters in 2010. Leatherback Inland water Northern Spotted Owl 16 Salamander Long-Toed California Desert Toad Condor 40 Coastal water 6 2 40 20 X 10 4 x Turtle 2 60 a. What type of data is presented in the table above (continuous or discrete), and why? iscrete / it do est cave and fraction or b. Using the graph paper provided plot a graph to present this data. Label all the axes and include all elements of the graph including a descriptive title. ( c. Which species prefer coastal than inland waters? (1 point) Leatherback Turtle Long-toed salamande✓ See graph d. What type of graph did you plot? Why did you choose this type of graph to present th data? (Hint: Is temperature a discrete or continuous data?)arrow_forwarda) True or False: Prokaryotes regulate their genes to create homeostasis while eukaryotes regulate to quickly adapt to a changing environment. b) Describe DNA methylation and how it impacts gene regulation. c) Draw a histone that is acetylated and insert below:arrow_forwarda) What is a silencer and how does it impact transcription? b) enhancers are proteins DNA regions Neither Both c) mediators are proteins DNA regions Neither Botharrow_forward
- Nonearrow_forwarda) What are the names of the enzymes that add acetyl groups to histones and what are the names of the enzymes that remove them? b) What is the difference between general transcription factors and specific transcription factors (also called genetic switches.) c) What is an activator and how does it impact transcription?arrow_forwardWhat are your personal thoughts after reviewing these three aricles below? A Comprehensive Biomedical Variant Catalogue Based on Whole Genome Sequences of 582 Dogs and Eight Wolves (Jagannathan et al., 2019) The research consists of a catalog of genetic variants from the WGS of 582 dogs of 126 breeds plus 8 wolves, according to Jagannathan et al. (2019). In a study performed by the DBVDC, more than 23 million single nucleotide variations (SNVs) and over 10 million short insertions and deletions were discovered. Perhaps more worrisome, 93 of these variants were new and had not been reported earlier. This research will focus on shedding some light on genetic diseases prevalent in the dog population, most of which are similar to those affecting humans and, thus, would be very useful in both canine and human research fields. New Insights into the Genetic Composition and Phylogenetic Relationship of Wolves and Dogs in the Iberian Peninsula (Pires et al., 2017) In the present work, Pires et…arrow_forward
 Human Biology (MindTap Course List)BiologyISBN:9781305112100Author:Cecie Starr, Beverly McMillanPublisher:Cengage Learning
 Biology (MindTap Course List)BiologyISBN:9781337392938Author:Eldra Solomon, Charles Martin, Diana W. Martin, Linda R. BergPublisher:Cengage Learning


