Engineering Economy (17th Edition)
17th Edition
ISBN: 9780134870069
Author: William G. Sullivan, Elin M. Wicks, C. Patrick Koelling
Publisher: PEARSON
expand_more
expand_more
format_list_bulleted
Videos
Textbook Question
Chapter 3, Problem 19P
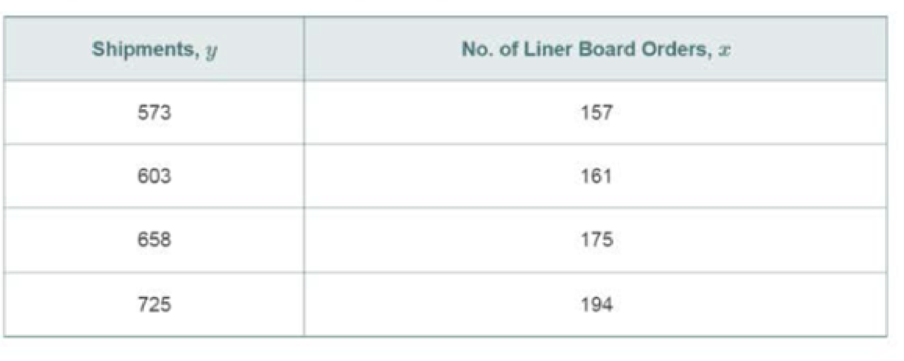
For the data below (3.4 .3)
- a. Find the regression equation, y = b0 + b1x.
- b. If x = 170orders, how many shipments are expected?
Expert Solution & Answer
Want to see the full answer?
Check out a sample textbook solution
Students have asked these similar questions
General Accounting Question solution and give me Blank ? C
It is possible to use transformational leadership strategies to reach unethical objectives.
Traditional leadership theories and morals standards are not adequate to help employees solve complex organizational issues.
For the statement above, argue in position for both in favor or opposed to the statements.
Discuss the preferred deterrent method employed by the Zambian government to combat tax evasion, monetary fines. As noted in the reading the potential penalty for corporate tax evasion is a fine of 52.5% of the amount evaded plus interest assessed at 5% annually along with a possibility of jail time. In general, monetary fines as a deterrent are preferred to blacklisting of company directors, revoking business operation licenses, or calling for prison sentences. Do you agree with this preference? Should companies that are guilty of tax evasion face something more severe than a monetary fine? Something less severe? Should the fine and interest amount be set at a different rate? If so at why? Provide support and rationale for your responses.
Chapter 3 Solutions
Engineering Economy (17th Edition)
Ch. 3 - A green (environmentally friendly) office building...Ch. 3 - You are planning to build a new home with...Ch. 3 - Prob. 3PCh. 3 - Prob. 4PCh. 3 - Prob. 5PCh. 3 - Prob. 6PCh. 3 - Prob. 7PCh. 3 - Prepare a composite (weighted) index for housing...Ch. 3 - Prepare a composite (weighted) index for housing...Ch. 3 - Prob. 10P
Ch. 3 - Prob. 11PCh. 3 - Prob. 12PCh. 3 - Prob. 13PCh. 3 - The capital investment cost for a...Ch. 3 - The capacity of a switch grass-fueled ethanol...Ch. 3 - Prob. 16PCh. 3 - The time to assemble the first unit on a...Ch. 3 - Prob. 18PCh. 3 - For the data below (3.4 .3) a. Find the regression...Ch. 3 - A company that manufactures shuttle cars and mines...Ch. 3 - Prob. 21PCh. 3 - Prob. 22PCh. 3 - Prob. 23PCh. 3 - Prob. 24PCh. 3 - Prob. 25PCh. 3 - Prob. 26PCh. 3 - Prob. 28SECh. 3 - Prob. 31CSCh. 3 - Prob. 32CSCh. 3 - Prob. 36FECh. 3 - Prob. 37FECh. 3 - Prob. 38FECh. 3 - Prob. 39FECh. 3 - Prob. 40FECh. 3 - Prob. 41FE
Additional Business Textbook Solutions
Find more solutions based on key concepts
10-10 What challenges do managers face in managing global teams? How should those challenges be handled?
Fundamentals of Management (10th Edition)
Mary Williams, owner of Williams Products, is evaluating whether to introduce a new product line. After thinkin...
Operations Management: Processes and Supply Chains (12th Edition) (What's New in Operations Management)
How is activity-based costing useful for pricing decisions?
Horngren's Cost Accounting: A Managerial Emphasis (16th Edition)
A typical discounted price of a AAA battery is 0.75. It is designed to provide 1.5 volts and 1.0 amps for about...
Engineering Economy (17th Edition)
Assume you are a CFO of a company that is attempting to race additional capital to finance an expansion of its ...
Financial Accounting, Student Value Edition (5th Edition)
E6-14 Using accounting vocabulary
Learning Objective 1, 2
Match the accounting terms with the corresponding d...
Horngren's Accounting (12th Edition)
Knowledge Booster


Learn more about
Need a deep-dive on the concept behind this application? Look no further. Learn more about this topic, economics and related others by exploring similar questions and additional content below.Similar questions
- answerarrow_forwardDiscuss the preferred deterrent method employed by the Zambian government to combat tax evasion, monetary fines. As noted in the reading the potential penalty for corporate tax evasion is a fine of 52.5% of the amount evaded plus interest assessed at 5% annually along with a possibility of jail time. In general, monetary fines as a deterrent are preferred to blacklisting of company directors, revoking business operation licenses, or calling for prison sentences. Do you agree with this preference? Should companies that are guilty of tax evasion face something more severe than a monetary fine? Something less severe? Should the fine and interest amount be set at a different rate? If so at why? Provide support and rationale for your responses.arrow_forwardNot use ai pleasearrow_forward
- For the statement below, argue in position for both in favor or opposed to the statement. Incompetent leaders can't be ethical leaders. Traditional leadership theories and moral standards are not adequate to help employees solve complex organizational issues.arrow_forwardpresentation on "Dandelion Insomnia." Poemarrow_forwardDon't used Ai solutionarrow_forward
- "Whether the regulator sells or gives away tradeable emission permits free of charge, the quantities of emissions produced by firms are the same." Assume that there are n identical profit-maximising firms where profit for each firm is given by π(e) with л'(e) > 0; π"(e) < 0 and e denotes emissions. Individual emissions summed over all firms gives E which generates environmental damages D(E). Show that the regulator achieves the optimal level of total pollution through a tradeable emission permit scheme, where the permits are distributed according to the following cases: Case (i) the firm purchases all permits; Case (ii) the firm receives all permits free; and Page 3 of 5 ES30031 Case (iii) the firm purchases a portion of its permits and receives the remainder free of charge.arrow_forwardcompare and/or contrast the two plays we've been reading, Antigone and A Doll's House.arrow_forwardPlease answer step by steparrow_forward
- Suppose there are two firms 1 and 2, whose abatement costs are given by c₁ (e₁) and C2 (е2), where e denotes emissions and subscripts denote the firm. We assume that c{(e) 0 for i = 1,2 and for any level of emission e we have c₁'(e) # c₂' (e). Furthermore, assume the two firms make different contributions towards pollution concentration in a nearby river captured by the transfer coefficients ε₁ and 2 such that for any level of emission e we have C₂'(e) # The regulator does not know the resulting C₁'(e) Τι environmental damages. Using an analytical approach explain carefully how the regulator may limit the concentration of pollution using (i) a Pigouvian tax scheme and (ii) uniform emissions standards. Discuss the cost-effectiveness of both approaches to control pollution.arrow_forwardBill’s father read that each year a car’s value declines by 10%. He also read that a new car’s value declines by 12% as it is driven off the dealer’s lot. Maintenance costs and the costs of “car problems” are only $200 per year during the 2-year warranty period. Then they jump to $750 per year, with an annual increase of $500 per year.Bill’s dad wants to keep his annual cost of car ownership low. The car he prefers cost $30,000 new, and he uses an interest rate of 8%. For this car, the new vehicle warranty is transferrable.(a) If he buys the car new, what is the minimum cost life? What is the minimum EUAC?(b) If he buys the car after it is 2 years old, what is the minimum cost life? What is the minimum EUAC?(c) If he buys the car after it is 4 years old, what is the minimum cost life? What is the minimum EUAC?(d) If he buys the car after it is 6 years old, what is the minimum cost life? What is the minimum EUAC?(e) What strategy do you recommend? Why? Please show each step and formula,…arrow_forwardO’Leary Engineering Corp. has been depreciating a $50,000 machine for the last 3 years. The asset was just sold for 60% of its first cost. What is the size of the recaptured depreciation or loss at disposal using the following depreciation methods?(a) Straight-line with N = 8 and S = 2000(b) Double declining balance with N = 8(c) 40% bonus depreciation with the balance using 7-year MACRS Please show every step and formula, don't use excel. The answer should be (a) $2000 loss, (b) $8000 deo recap, (c) $14257 dep recap, thank you.arrow_forward
arrow_back_ios
SEE MORE QUESTIONS
arrow_forward_ios
Recommended textbooks for you
 Managerial Economics: Applications, Strategies an...EconomicsISBN:9781305506381Author:James R. McGuigan, R. Charles Moyer, Frederick H.deB. HarrisPublisher:Cengage Learning
Managerial Economics: Applications, Strategies an...
Economics
ISBN:9781305506381
Author:James R. McGuigan, R. Charles Moyer, Frederick H.deB. Harris
Publisher:Cengage Learning
Sales Management | Sales management Process; Author: Educationleaves;https://www.youtube.com/watch?v=6tDfPoEOOoE;License: Standard youtube license