
(a)
To make a
(a)
Answer to Problem 28.14AYK
The strongest
Explanation of Solution
In the question, it is given that experimenters assessed the concentration of lactic acid, acetic acid and hydrogen sulfide in thirty randomly chosen pieces of cheddar cheese. The table is given which shows the data. The scatterplot with taste on the y axis is as follows:
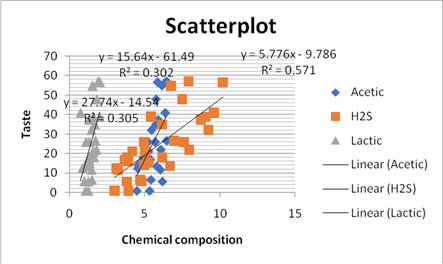
As we can see in the scatterplot that all the lines are almost parallel and also that the R -square of the hydrogen sulfide is largest with taste so the correlation is largest for the hydrogen sulfide. The correlation is given in the scatterplot above by finding square root, the calculation is as:
| Acetic | =SQRT(0.302) |
| Lactic | =SQRT(0.3055) |
| H2S | =SQRT(0.5712) |
And the result is as:
| Acetic | 0.549545 |
| Lactic | 0.552721 |
| H2S | 0.755778 |
(b)
To use a software to obtain the regression equation and run inference for a regression model that includes all three explanatory variables and interpret the software output, including the meaning of the value taken by
(b)
Answer to Problem 28.14AYK
The equation is
Explanation of Solution
In the question, it is given that experimenters assessed the concentration of lactic acid, acetic acid and hydrogen sulfide in thirty randomly chosen pieces of cheddar cheese. The table is given which shows the data. Now, run inference for a regression model that includes all three explanatory variables and interpret the software output by using the Excel, the result will be as:
| Regression Statistics | |
| Multiple R | 0.800438 |
| R Square | 0.640701 |
| Adjusted R Square | 0.599243 |
| Standard Error | 10.29053 |
| Observations | 30 |
| ANOVA | |||||
| df | SS | MS | F | Significance F | |
| Regression | 3 | 4909.619 | 1636.54 | 15.45438 | 5.68E-06 |
| Residual | 26 | 2753.268 | 105.8949 | ||
| Total | 29 | 7662.887 |
| Coefficients | Standard Error | t Stat | P-value | |
| Intercept | -32.8566 | 20.2335 | -1.62387 | 0.116466 |
| Acetic | 2.000654 | 4.346475 | 0.460294 | 0.649132 |
| H2S | 4.566348 | 1.176917 | 3.879925 | 0.000639 |
| Lactic | 13.67117 | 6.643259 | 2.057902 | 0.049755 |
And the equation is as:
And
(c)
To explain which explanatory variable does it describe and create a new regression model that excludes this explanatory variable and interpret the software output and compare it with your findings in (b).
(c)
Answer to Problem 28.14AYK
That explanatory variable is Acetic.
Explanation of Solution
In the question, it is given that experimenters assessed the concentration of lactic acid, acetic acid and hydrogen sulfide in thirty randomly chosen pieces of cheddar cheese. The table is given which shows the data. In the above result in part (b), we can see that the explanatory variable Acetic has a P-value greater than the level of significance so it is not significant. Thus, we will remove this variable and run this test with the other two variables using Excel and the result will be as:
| Regression Statistics | |
| Multiple R | 0.798607 |
| R Square | 0.637773 |
| Adjusted R Square | 0.610941 |
| Standard Error | 10.13922 |
| Observations | 30 |
| ANOVA | |||||
| df | SS | MS | F | Significance F | |
| Regression | 2 | 4887.183 | 2443.592 | 23.76946 | 1.11E-06 |
| Residual | 27 | 2775.704 | 102.8038 | ||
| Total | 29 | 7662.887 |
| Coefficients | Standard Error | t Stat | P-value | |
| Intercept | -24.4609 | 8.629104 | -2.8347 | 0.008581 |
| H2S | 4.858662 | 0.976305 | 4.976581 | 3.24E-05 |
| Lactic | 14.28672 | 6.411593 | 2.228263 | 0.034385 |
In this all the explanatory variables are statistically significant but in the above model in (b) all are not statistically significant but the variations explained are approximately equal.
(d)
To explain which explanatory variable of the two has the less significant or larger value and create a new regression model that excludes this explanatory variable and keeps only significant one and explain how does this last model compare with the model in (c).
(d)
Answer to Problem 28.14AYK
The explanatory variable of the two has the less significant or larger value is lactic.
Explanation of Solution
In the question, it is given that experimenters assessed the concentration of lactic acid, acetic acid and hydrogen sulfide in thirty randomly chosen pieces of cheddar cheese. The table is given which shows the data. In the above result in part (c), we can see that the P-value for the Lactic is larger than the hydrogen sulfide thus, we will remove the Lactic variable and then run the
| Regression Statistics | |
| Multiple R | 0.755752 |
| R Square | 0.571162 |
| Adjusted R Square | 0.555846 |
| Standard Error | 10.83338 |
| Observations | 30 |
| ANOVA | |||||
| df | SS | MS | F | Significance F | |
| Regression | 1 | 4376.746 | 4376.746 | 37.29265 | 1.37E-06 |
| Residual | 28 | 3286.141 | 117.3622 | ||
| Total | 29 | 7662.887 |
| Coefficients | Standard Error | t Stat | P-value | |
| Intercept | -9.78684 | 5.95791 | -1.64266 | 0.111638 |
| H2S | 5.776089 | 0.94585 | 6.10677 | 1.37E-06 |
In this as we compare it with the model in part (c), we can see that the coefficient of determination or the variations explained are less in this model then in part (c) and all the slopes are statistically significant.
(e)
To explain which model best explains cheddar taste and check the conditions for inference for this model and conclude.
(e)
Answer to Problem 28.14AYK
Model (b) best explains cheddar taste and conditions are met.
Explanation of Solution
In the question, it is given that experimenters assessed the concentration of lactic acid, acetic acid and hydrogen sulfide in thirty randomly chosen pieces of cheddar cheese. The table is given which shows the data. By looking at the model (b), (c) and (d), we can say that the variations explained is more in part (b) than in (c) and (d). Thus, the model in (b) best explains cheddar taste. The conditions for inferences are as: as we can see in the scatterplot, it shows the linearity and as we look at the data it shows the normality and constant variance by looking at the model regression analysis using Excel’s residual plot and the data is randomly selected so it shows independence. Thus, the conditions are met.
Want to see more full solutions like this?
Chapter 28 Solutions
Practice of Statistics in the Life Sciences

 MATLAB: An Introduction with ApplicationsStatisticsISBN:9781119256830Author:Amos GilatPublisher:John Wiley & Sons Inc
 Probability and Statistics for Engineering and th...StatisticsISBN:9781305251809Author:Jay L. DevorePublisher:Cengage Learning
 Statistics for The Behavioral Sciences (MindTap C...StatisticsISBN:9781305504912Author:Frederick J Gravetter, Larry B. WallnauPublisher:Cengage Learning
 Elementary Statistics: Picturing the World (7th E...StatisticsISBN:9780134683416Author:Ron Larson, Betsy FarberPublisher:PEARSON
 The Basic Practice of StatisticsStatisticsISBN:9781319042578Author:David S. Moore, William I. Notz, Michael A. FlignerPublisher:W. H. Freeman
 Introduction to the Practice of StatisticsStatisticsISBN:9781319013387Author:David S. Moore, George P. McCabe, Bruce A. CraigPublisher:W. H. Freeman