
Elementary Statistics ( 3rd International Edition ) Isbn:9781260092561
3rd Edition
ISBN: 9781259969454
Author: William Navidi Prof.; Barry Monk Professor
Publisher: McGraw-Hill Education
expand_more
expand_more
format_list_bulleted
Concept explainers
Videos
Textbook Question
Chapter 2.3, Problem 29E
Dining out: The following time-series plot presents the amount spent, in billions of dollars. on dining out by U.S. residents for the years 1997—2014.
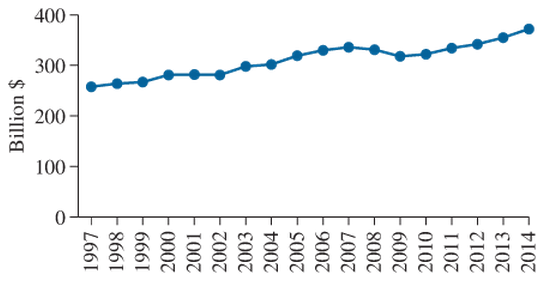
- Estimate the amount spent on dining out in 2003.
- Was the amount spent in 2005 greater than, less than, or about the same as the amount spent in 2009?
- True or false: The amount spent in 2014 is approximately twice as much as the amount spent in 1997.
- In 2008, an economic downturn known as the Great Recession occurred. What was the effect on the amount of money spent on dining out?
Expert Solution & Answer
Want to see the full answer?
Check out a sample textbook solution
Students have asked these similar questions
The value of all goods and services produced in a nation during a specific period of time, as compared to an earlier period, is called the economic growth rate. It measures the change in a nation's gross domestic product (GDP). The United States had an economic growth rate of approximately 2.9%and GDP of approximately $20.58 trillion in 2018. If the economic growth rate is expected to stay the same for the next 3 years, what is the projected GDP for the year 2021?
a
$21.96 trillion
b
$23.15 trillion
c
$22.42 trillion
d
$22.31 trillion
A business depreciates it’s three-dimensional printer at a rate of 12.3% per year. If the printer cost $900 in 2012, what is its depreciated rate in 2019?
a. $432.19
b. $297.54
c. $504.62
d. $359.12
Often lottery winnings are divided into equal payments given annually for 20 – 25 years. So the present value of the winnings is worth less than the actual jackpot, depending on the rate at
which money could be invested. Find the present value in dollars using the given conditions.
Complete the table for each amount, interest rate, and number of payments.
Jackpot Amount
Interest Rate
Equal Annual Payments Present Value (in dollars)
$7,000,000
8%
20
$7,000,000
14%
20
$4
$7,000,000
8%
25
$
$7,000,000
14%
25
(Round to the nearest dollar as needed.)
Chapter 2 Solutions
Elementary Statistics ( 3rd International Edition ) Isbn:9781260092561
Ch. 2.1 - In Exercises 5-8, fill in each blank with the...Ch. 2.1 - In Exercises 5-8, fill in each blank with the...Ch. 2.1 - In Exercises 5-8, fill in each blank with the...Ch. 2.1 - In Exercises 5-8, fill in each blank with the...Ch. 2.1 - In Exercises 9—12, determine whether the...Ch. 2.1 - In Exercises 9—12, determine whether the...Ch. 2.1 - In Exercises 9—12, determine whether the...Ch. 2.1 - In Exercises 9—12, determine whether the...Ch. 2.1 - The following bar graph presents the average...Ch. 2.1 - The most common blood typing system divides human...
Ch. 2.1 - Following is a pie chart that presents the...Ch. 2.1 - Government spending: The following pie chart...Ch. 2.1 - U.S. population: The following side-by-side bar...Ch. 2.1 - Super Bowl: The following side-by-side bar graph...Ch. 2.1 - Smartphone sales: The following frequency...Ch. 2.1 - Popular video games: The following frequency...Ch. 2.1 - More smartphones: Using the data in Exercise 19:...Ch. 2.1 - More video games: Using the data in Exercise 20:...Ch. 2.1 - Hospital admissions: The following frequency...Ch. 2.1 - World population: Following are the populations of...Ch. 2.1 - Ages of video garners: The Nielsen Company...Ch. 2.1 - How secure is your job? In a survey, employed...Ch. 2.1 - Back up your data: In a survey commissioned by the...Ch. 2.1 - Education levels: The following frequency...Ch. 2.1 - Twitter followers: The following frequency...Ch. 2.1 - Music sales: The following frequency distribution...Ch. 2.1 - Keeping up with the Kardashians: The following...Ch. 2.1 - Bought a new car lately? The following table...Ch. 2.1 - Bought a new- truck lately? The following table...Ch. 2.1 - Happy Halloween: The following table presents...Ch. 2.1 - Native languages: The following frequency...Ch. 2.1 - Proportion of females: Following are the...Ch. 2.2 - Prob. 5ECh. 2.2 - In Exercises 5—8, fill in each blank with the...Ch. 2.2 - In Exercises 5—8, fill in each blank with the...Ch. 2.2 - In Exercises 5—8, fill in each blank with the...Ch. 2.2 - In Exercises 9—12, determine whether the...Ch. 2.2 - In Exercises 9—12, determine whether the...Ch. 2.2 - In Exercises 9—12, determine whether the...Ch. 2.2 - In Exercises 9—12, determine whether the...Ch. 2.2 - In Exercises 13—16, classify the histogram as...Ch. 2.2 - In Exercises 13—16, classify the histogram as...Ch. 2.2 - In Exercises 13—16, classify the histogram as...Ch. 2.2 - In Exercises 13—16, classify the histogram as...Ch. 2.2 - In Exercises 17 and 18, classify the histogram as...Ch. 2.2 - In Exercises 17 and 18, classify the histogram as...Ch. 2.2 - Student heights: The following frequency histogram...Ch. 2.2 - Trained rats: Forty rats were trained to run a...Ch. 2.2 - Cholesterol: The following histogram shows the...Ch. 2.2 - Blood pressure: The following histogram shows the...Ch. 2.2 - Olympic athletes: The following frequency...Ch. 2.2 - Hows the weather? The following relative frequency...Ch. 2.2 - Skewed which way? For which of the following data...Ch. 2.2 - Skewed which way? For which of the following data...Ch. 2.2 - Batting average: The following frequency...Ch. 2.2 - Batting average: The following frequency...Ch. 2.2 - Time spent playing video games: A sample of 200...Ch. 2.2 - Murder, she wrote: The following frequency...Ch. 2.2 - BMW prices: The following table presents the...Ch. 2.2 - Geysers: The geyser Old Faithful in Yellowstone...Ch. 2.2 - Hail to the chief: There have been 58 presidential...Ch. 2.2 - Internet radio: The following table presents the...Ch. 2.2 - Brothers and sisters: Thirty students in a...Ch. 2.2 - Cough, cough: The following table presents the...Ch. 2.2 - Prob. 37ECh. 2.2 - Prob. 38ECh. 2.2 - Prob. 39ECh. 2.2 - Prob. 40ECh. 2.2 - Frequency polygon: Using the data in Exercise 29:...Ch. 2.2 - Prob. 42ECh. 2.2 - Ogive: Using the data in Exercise 27: Compute the...Ch. 2.2 - Ogive: Using the data in Exercise 28: Compute the...Ch. 2.2 - Ogive: Using the data in Exercise 29: Compute the...Ch. 2.2 - Prob. 46ECh. 2.2 - Prob. 47ECh. 2.2 - Prob. 48ECh. 2.2 - Prob. 49ECh. 2.2 - Prob. 50ECh. 2.2 - Prob. 51ECh. 2.2 - Prob. 52ECh. 2.2 - Frequencies and relative frequencies: The...Ch. 2.3 - In Exercises 3—6, fill in each blank with the...Ch. 2.3 - In Exercises 3—6, fill in each blank with the...Ch. 2.3 - In Exercises 3—6, fill in each blank with the...Ch. 2.3 - In Exercises 3—6, fill in each blank with the...Ch. 2.3 - Prob. 7ECh. 2.3 - In Exercises 7—10, determine whether the...Ch. 2.3 - In Exercises 7—10, determine whether the...Ch. 2.3 - In Exercises 7—10, determine whether the...Ch. 2.3 - Construct a stem-and-leaf plot for the following...Ch. 2.3 - Construct a stem-and-leaf plot for the following...Ch. 2.3 - List the data in the following stem-and-leaf plot....Ch. 2.3 - List the data in the following stein-and-leaf...Ch. 2.3 - Construct a dotplot for the data in Exercise 11.Ch. 2.3 - Prob. 16ECh. 2.3 - BMW prices: The following table presents the...Ch. 2.3 - Hows the weather? The following table presents the...Ch. 2.3 - Air pollution: The following table presents...Ch. 2.3 - Technology salaries: The following table presents...Ch. 2.3 - Tennis and golf: Following are the ages of the...Ch. 2.3 - Pass the popcorn: Following are the running times...Ch. 2.3 - More weather: Construct a dotplot for the data in...Ch. 2.3 - Prob. 24ECh. 2.3 - Looking for a job: The following table presents...Ch. 2.3 - Prob. 26ECh. 2.3 - Military spending: The following table presents...Ch. 2.3 - Prob. 28ECh. 2.3 - Dining out: The following time-series plot...Ch. 2.3 - Prob. 30ECh. 2.3 - Prob. 31ECh. 2.3 - More gold: The following time series plot presents...Ch. 2.3 - Prob. 33ECh. 2.3 - Prob. 34ECh. 2.3 - Vote: The following time-series plot presents the...Ch. 2.3 - Arctic ice sheet: The following table presents the...Ch. 2.3 - Prob. 37ECh. 2.4 - In Exercises 3 and 4, fill in each blank with the...Ch. 2.4 - In Exercises 3 and 4, fill in each blank with the...Ch. 2.4 - CD sales decline: Sales of CDs have been declining...Ch. 2.4 - Music sales: The following time-series plot and...Ch. 2.4 - Stock market prices: The Dow Jones Industrial...Ch. 2.4 - Save your money: In 2007, U.S. residents saved...Ch. 2.4 - Ill take mine with mustard: The following bar...Ch. 2.4 - Stream or download? The following bar graph...Ch. 2.4 - Female senators: Of the 100 members of the United...Ch. 2.4 - Age at marriage: Data compiled by the U.S. Census...Ch. 2.4 - College degrees: Both of the following time-series...Ch. 2.4 - Food expenditures: Both of the following...Ch. 2.4 - Prob. 15ECh. 2 - Following is the list of letter grades for...Ch. 2 - Prob. 2CQCh. 2 - Construct a frequency bar graph for the data in...Ch. 2 - Prob. 4CQCh. 2 - Prob. 5CQCh. 2 - Prob. 6CQCh. 2 - Prob. 7CQCh. 2 - Prob. 8CQCh. 2 - Prob. 9CQCh. 2 - Prob. 10CQCh. 2 - Following are the prices (in dollars) for a sample...Ch. 2 - Prob. 12CQCh. 2 - Prob. 13CQCh. 2 - Prob. 14CQCh. 2 - Prob. 15CQCh. 2 - Trust your doctor: The General Social Survey...Ch. 2 - Internet browsers: The following relative...Ch. 2 - Prob. 3RECh. 2 - Prob. 4RECh. 2 - Prob. 5RECh. 2 - House freshmen: Newly elected members of the U.S....Ch. 2 - More freshmen: For the data in Exercise 6:...Ch. 2 - Royalty: Following are the ages at death for all...Ch. 2 - Prob. 9RECh. 2 - Prob. 10RECh. 2 - Prob. 11RECh. 2 - Prob. 12RECh. 2 - Prob. 13RECh. 2 - Prob. 14RECh. 2 - Prob. 15RECh. 2 - Explain why the frequency bar graph and the...Ch. 2 - Prob. 2WAICh. 2 - Prob. 3WAICh. 2 - Prob. 4WAICh. 2 - Prob. 5WAICh. 2 - In the chapter introduction, we presented gas...Ch. 2 - In the chapter introduction, we presented gas...Ch. 2 - In the chapter introduction, we presented gas...Ch. 2 - Prob. 4CSCh. 2 - In the chapter introduction, we presented gas...Ch. 2 - Prob. 6CSCh. 2 - In the chapter introduction, we presented gas...Ch. 2 - Prob. 8CSCh. 2 - In the chapter introduction, we presented gas...
Knowledge Booster


Learn more about
Need a deep-dive on the concept behind this application? Look no further. Learn more about this topic, statistics and related others by exploring similar questions and additional content below.Similar questions
- Question 1 Employees in 2012 paid 4.2% of their gross wages towards social security (FICA tax), while employers paid another 6.2%. How much will someone earning $22,000 a year pay towards social security out of their gross wages? You should show your work for this question. Give your answer accurate to at least the nearest dollar. Question Help: Video Submit Question 31 8.arrow_forwardThe average home in Metropolis in 2008 was $247,100. In 2009, it was $268,900. The average home price in Smallville in 2008 was $114,000. In 2009, it was $139,300. If these trends continue, when will Smallville's average home price exceed that of Metropolis? (Round your answer to one decimal place.) Smallville's average home price will exceed that of Metropolis in ____ years.arrow_forward1. Make a scatter plot of the table provided in the image. B. Write a linear/exponential equation that models this table provided in the image. C. Explain what the slope/multiplier means in the context of the problem. E. Use your model to predict when there will be 100 new casesarrow_forward
- A short article in the January 10, 2011 edition of The New York Times discussed the amount spent on DVDs over the past six years: (In 2004) consumers spent about $21.8billion to rent and and buy DVDs, Blu-ray discs, digital downloads and other forms of home entertainment...The number has fallen every year since, for a total drop of about 13.8 percent, to $18.8 billion in 2010. The reporter noted that the actual drop was about double what it seemed to be when the figures were adjusted for inflation: $21.8 billion figure from 2004 would amount to $25.3billion in current dollars. If we adjust for inflation, how dramatic is the drop in spending over the six year period? check_circlearrow_forwardChina had a population in 2008 of about 1.14 billion people. The populaton is growing by about 1.34% each year. If this trend continues, when will China's population reach 1.2 billion.arrow_forwardAn entrepreneur who owns and operates two businesses (A and B) would like to analyze their profitability. They would like your help in the analysis. They give you the annual net profit (in thousands of $) for each business from 2008-2020. Table 1: Annual Net Profits for Businesses A and B Business Year Profit Business Year Profit 2008 -50 2008 -10 2009 57 2009 30 2010 71 2010 27 2011 64 2011 22 2012 60 2012 21 2013 50 2013 20 A 2014 41 2014 24 2015 59 2015 24 2016 71 2016 32 2017 71 2017 36 2018 74 2018 37 019 81 20 40 2020 97 2020 49 a. Suppose you want to graph the distribution of profits. Explain why using only one stem- plot might not be optimal for the analysis. b. Describe the correct stemplot to use. Generate this stemplot. Explain your steps. What can you say about the distribution from this stemplot? c. When are stemplots useful? And why is that? d. Suppose that instead of having 26 observations you have 200 observations. What graph should you generate? e. What other type of…arrow_forward
- Question 10 In 2014, the median salary nationwide for a high school teacher was $56,310 per year. The median annual wage for all workers was $35,540. SOURCE: United States. Department of Labor. "High School Teachers." Occupational 0utlook Handbook. 17 Dec. 2015. Web. 7 March 2016. Suppose a worker makes $29,000 in wages per year. Find the percent increase in salary the worker can expect if he/she trains to be a teacher and can expect to earn a salary of $49,000. Enter your response to the nearest 0.1% Submit Questionarrow_forwardIn 2010, a new type of computer was introduced and approximately 20 million were sold. In 2011, the number sold increased by a factor of approximately 2.5. Assuming that the sales follow a linear trend through 2016, approximately how many of these computers will be sold in 2016? How many computers in millions?arrow_forwardSuppose a man invested $250 at the end of 1900 in each of three funds that tracked the averages of stocks, bonds, and cash, respectively. Assuming that his investments grew at the rates given in the table to the right, approximately how much would each investment have been worth at the end of 2007? His investment in the fund tracking stocks would be worth approximately $. (Do not round until the final answer. Then round to two decimal places as needed.) Category Stocks Bonds Cash Average Annual Return 6.7% 2.4% 0.7%arrow_forward
- A cheese manufacturer produces18,000 pounds of cheese from January 1 through March 24.Suppose that this rate of production continues for the remainderof the year. Predict, to the nearest pound, the number of pounds produced for the year.arrow_forwardT. 7/11 > Memorabilia are the kinds of things that everyone once had but are now rare or scarce years later. They are usually hard to find, so they become worth more money than they originally cost. For Example: Past issues of TV Guide of the 1950s and 1960s sold for as little as $0.15 per copy during that time. Today these copies may fetch as much as $25 to $30 each from collections. $0.28 Assuming an Issue of TV Guide that once sold for $0.15 now sold for $0.28 in 198o, what is the percent increase? X 186.67 $0.15 100 186. 67 100 87% increase CFU Check for Understanding The price of the TV Guide increased to $25 dollar in 2015, what is the percent increase from the original price to 2015?arrow_forwardThe number of people in a small country town increases by 2% per year. If the population at the start of 1970 was 12500, what is the predicted population at the start of the year 2010?arrow_forward
arrow_back_ios
SEE MORE QUESTIONS
arrow_forward_ios
Recommended textbooks for you
 Glencoe Algebra 1, Student Edition, 9780079039897...AlgebraISBN:9780079039897Author:CarterPublisher:McGraw Hill
Glencoe Algebra 1, Student Edition, 9780079039897...
Algebra
ISBN:9780079039897
Author:Carter
Publisher:McGraw Hill
The Shape of Data: Distributions: Crash Course Statistics #7; Author: CrashCourse;https://www.youtube.com/watch?v=bPFNxD3Yg6U;License: Standard YouTube License, CC-BY
Shape, Center, and Spread - Module 20.2 (Part 1); Author: Mrmathblog;https://www.youtube.com/watch?v=COaid7O_Gag;License: Standard YouTube License, CC-BY
Shape, Center and Spread; Author: Emily Murdock;https://www.youtube.com/watch?v=_YyW0DSCzpM;License: Standard Youtube License