
EP STATISTICS F/BUS.+ECON.-ACCESS 18 WK
13th Edition
ISBN: 9780135960912
Author: MCCLAVE
Publisher: PEARSON CO
expand_more
expand_more
format_list_bulleted
Videos
Textbook Question
Chapter 2.3, Problem 2.46ACB
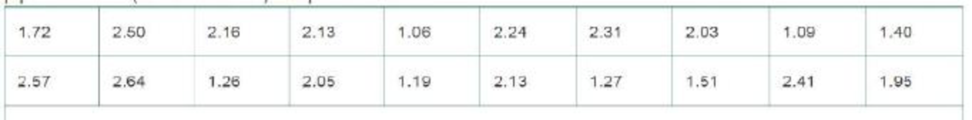
Surface roughness of oil field pipe. Oil field pipes are internally coated in order to prevent corrosion. Researchers at the University of Louisiana, Lafayette, investigated the influence that coating may have on the surface roughness of oil field pipes (Anti-corrosion Methods and Materials, Vol. 50, 2003). A scanning probe instrument was used to measure the surface roughness of each in a sample of 20 sections of coated interior pipe The data (in micrometers) are provided in the table.
- a. Find and interpret the
mean of the sample. - b. Find and interpret the
median of the sample. - c. Which measure of
central tendency —the mean or the median—best describes the surface roughness of the sampled pipe sections? Explain.
Expert Solution & Answer
Want to see the full answer?
Check out a sample textbook solution
Students have asked these similar questions
Trace metals in drinking water affect the flavor and an unusually high concentration can pose a
health hazard. Ten pairs of data were taken measuring zinc concentration in bottom water and
surface water.
Bottom 0.430 0.266 0.567 0.531 0.707 0.716 0.651 0.589 0.469 0.723
Surface 0.415 0.238 0.390 0.410 0.605 0.609 0.632 0.523 0.411 0.612
With the help of Mathematics and R Studio: Does the data suggest that the true average
concentration in the bottom water is different than that of surface water? You can assume
that the conditions for inference are met.
an attempt to develop a model of wine quality as judged by wine experts, data on alcohol content and wine quality was collected from variants of a particular wine. From a sample of 12wines, a model was created using the percentages of alcohol to predict wine quality. For those data, SR=18,671 and SST=27,382.Use this information to complete parts (a) through (c) below. Please complete part 3(B) ONLY.
Question content area bottom
Part 1
a. Determine the coefficient of determination,
r2,
and interpret its meaning.
r2=0.682
(Round to three decimal places as needed.)
Part 2
Interpret the meaning of r2.
It means that
68.2
of the variation in
wine quality
can be explained by the variation in
alcohol content.
(Round to one decimal place as needed.)
Part 3
b. Determine the standard error of the estimate.
SYX=
(Round to four decimal places as needed.)
The quality control engineer at Palmer Industries is interested in estimating the tensile strength of steel wire based on its outside diameter and the amount of molybdenum in the steel. As an experiment, she selected 25 pieces of wire, measured the outside diameters, and determined the molybdenum content. Then she measured the tensile strength of each piece. The results of the first four are recorded in the table.
Tensile Strength
Outside Diameter
Amount of Molybdenum
Place
(PSI ) Y
(mm) X1
(Units) X2
A
11
0.3
6
B
9
0.2
5
C
16
0.4
8
D
12
0.3
7
Using a statistical software package, the QC engineer determined the multiple regression equation to be Y’=-0.5+20X1+1X2.
a) Based on the equation, what is the estimated tensile strength of a steel wire having an outside diameter of .35 mm and 6.4 units of molybdenum?
b) Interpret the value of b1 in the equation.
Chapter 2 Solutions
EP STATISTICS F/BUS.+ECON.-ACCESS 18 WK
Ch. 2.1 - Complete the following table.Ch. 2.1 - A qualitative variable with three classes (X, Y,...Ch. 2.1 - STEM experiences for girls. The National Science...Ch. 2.1 - Cable TV subscriptions and cord cutters. Has the...Ch. 2.1 - Do social robots walk or roll? A social (or...Ch. 2.1 - Top credit card issuers, by region. The Nilson...Ch. 2.1 - Microsoft program security issues. To help its...Ch. 2.1 - Jamming attacks on wireless networks. Refer to the...Ch. 2.1 - The Apprentice contestants performance ratings....Ch. 2.1 - The economic return to earning an MBA. Refer to...
Ch. 2.1 - Profiling UK rental malls. An analysis of the...Ch. 2.1 - History of corporate acquisitions. A corporate...Ch. 2.1 - Twitter opinions of iPhone 6 features. What are...Ch. 2.1 - Museum management. What criteria do museums use to...Ch. 2.1 - Advertising with reader-response cards....Ch. 2.1 - Motivation and right-oriented bias. Evolutionary...Ch. 2.1 - Groundwater contamination in wells. In New...Ch. 2.2 - Graph the relative frequency histogram for the 500...Ch. 2.2 - Refer to Exercise 2.18. Calculate the number of...Ch. 2.2 - Consider the stem-and-leaf display shown here. a....Ch. 2.2 - Minitab was used to generate the following...Ch. 2.2 - Stability of compounds in new drugs. Testing the...Ch. 2.2 - Corporate sustainability of CPA firms. Refer to...Ch. 2.2 - Sanitation inspection of cruise ships. To minimize...Ch. 2.2 - History of corporate acquisitions. Refer to the...Ch. 2.2 - Most valuable NFL teams. Each year Forbes reports...Ch. 2.2 - State SAT scores. Educators are constantly...Ch. 2.2 - Items arriving and departing a work center. In a...Ch. 2.2 - Crude oil biodegradation. In order to protect...Ch. 2.2 - Volkswagen emissions scandal. Recently, the...Ch. 2.2 - Is honey a cough remedy? Does a teaspoon of honey...Ch. 2.2 - Time in bankruptcy. Financially distressed firms...Ch. 2.2 - Prob. 2.33ACACh. 2.2 - Prob. 2.34ACACh. 2.3 - Calculate the mean and median of the following...Ch. 2.3 - Calculate the mean for samples where a. n = 10, x...Ch. 2.3 - Explain how the relationship between the mean and...Ch. 2.3 - Explain the difference between the calculation of...Ch. 2.3 - Calculate the mode, mean, and median of the...Ch. 2.3 - Calculate the mean, median, and mode for each of...Ch. 2.3 - Describe how the mean compares to the median for a...Ch. 2.3 - Use the applet entitled Mean versus Median to find...Ch. 2.3 - Prob. 2.2AECh. 2.3 - Use the applet Mean versus Median to study the...Ch. 2.3 - Hotels use of ecolabels. Ecolabels such as Energy...Ch. 2.3 - Rankings of research universities. Based on...Ch. 2.3 - Performance of stock screeners. Investment...Ch. 2.3 - Performance-based logistics. Refer to the Journal...Ch. 2.3 - Surface roughness of oil field pipe. Oil field...Ch. 2.3 - Prob. 2.47ACICh. 2.3 - Corporate sustainability of CPA firms. Refer to...Ch. 2.3 - Is honey a cough remedy? Refer to the Archives of...Ch. 2.3 - Crude oil biodegradation. Refer to the Journal of...Ch. 2.3 - Symmetric or skewed? Would you expect the data...Ch. 2.3 - Prob. 2.52ACICh. 2.3 - Prob. 2.53ACACh. 2.3 - Prob. 2.54ACACh. 2.3 - Prob. 2.55ACACh. 2.4 - Answer the following questions about variability...Ch. 2.4 - Calculate the range, variance, and standard...Ch. 2.4 - Calculate the variance and standard deviation for...Ch. 2.4 - Compute x,s2, and s for each of the following data...Ch. 2.4 - Calculate the range, variance, and standard...Ch. 2.4 - Using only integers between 0 and 10, construct...Ch. 2.4 - Using only integers between 0 and 10, construct...Ch. 2.4 - Consider the following sample of five...Ch. 2.4 - Use the applet entitled Standard Deviation to find...Ch. 2.4 - Use the applet Standard Deviation to study the...Ch. 2.4 - Use the applet Standard Deviation to study the...Ch. 2.4 - Hotels use of ecolabels. Refer to the Journal of...Ch. 2.4 - Permeability of sandstone during weathering. Refer...Ch. 2.4 - Performance of stock screeners. Refer to the...Ch. 2.4 - Corporate sustainability of CPA firms. Refer to...Ch. 2.4 - Is honey a cough remedy? Refer to the Archives of...Ch. 2.4 - Active nuclear power plants. Refer to Exercise...Ch. 2.4 - Estimating production time. A widely used...Ch. 2.5 - The output from a statistical software package...Ch. 2.5 - Prob. 2.72LMCh. 2.5 - For a set of data with a mound-shaped relative...Ch. 2.5 - The following is a sample of 25 measurements: a....Ch. 2.5 - Given a data set with a largest value of 760 and a...Ch. 2.5 - Voltage sags and swells. The power quality of a...Ch. 2.5 - Permeability of sandstone during weathering. Refer...Ch. 2.5 - Do social robots walk or roll? Refer to the...Ch. 2.5 - College dropout study. The American Economic...Ch. 2.5 - Motivation of drug dealers. Consider a study of...Ch. 2.5 - Sanitation inspection of cruise ships. Refer to...Ch. 2.5 - Volkswagen emissions scandal. Refer to the...Ch. 2.5 - Auditing water resources in Australia. Australia...Ch. 2.5 - The Apprentice contestants performance ratings....Ch. 2.5 - Shopping vehicle and judgment. While shopping at...Ch. 2.5 - Buy-side vs. sell-side analysts earnings...Ch. 2.5 - Prob. 2.87ACACh. 2.5 - Improving SAT scores. The National Education...Ch. 2.5 - Prob. 2.89ACACh. 2.6 - Compute the z-score corresponding to each of the...Ch. 2.6 - Give the percentage of measurements in a data set...Ch. 2.6 - In terms of percentiles, define QL, QM and QU.Ch. 2.6 - Compare the z-scores to decide which of the...Ch. 2.6 - Suppose that 40 and 90 are two elements of a...Ch. 2.6 - Mathematics assessment test scores. According to...Ch. 2.6 - Prob. 2.96ACBCh. 2.6 - Prob. 2.97ACBCh. 2.6 - Sanitation inspection of cruise ships Refer to the...Ch. 2.6 - Prob. 2.99ACICh. 2.6 - Prob. 2.100ACICh. 2.6 - Executive networking and firm performance. Do...Ch. 2.6 - Blue- vs. red-colored exam study. In a study of...Ch. 2.6 - Ranking PhD programs in economics. Thousands of...Ch. 2.6 - Using z-scores for grades. At one university, the...Ch. 2.6 - Prob. 2.105ACACh. 2.7 - A sample data set has a mean of 57 and a standard...Ch. 2.7 - Suppose a data set consisting of exam scores has a...Ch. 2.7 - Consider the horizontal box plot shown below. a....Ch. 2.7 - Prob. 2.109LMCh. 2.7 - Prob. 2.7AECh. 2.7 - Rankings of research universities. Refer to the...Ch. 2.7 - Voltage sags and swells. Refer to the Electrical...Ch. 2.7 - Treating psoriasis with the Doctorfish of Kangal....Ch. 2.7 - Budget lapsing at army hospitals. Accountants use...Ch. 2.7 - Salary offers to MBAs. Consider the top salary...Ch. 2.7 - Prob. 2.115ACICh. 2.7 - Prob. 2.116ACICh. 2.7 - Sanitation inspection of cruise ships. Referto...Ch. 2.7 - Network server downtime. A manufacturer of network...Ch. 2.7 - Permeability of sandstone during weathering. Refer...Ch. 2.7 - Prob. 2.120ACACh. 2.7 - Prob. 2.121ACACh. 2.8 - Construct a scatterplot for the data in the...Ch. 2.8 - Construct a scatterplot for the data in the...Ch. 2.8 - Prob. 2.124ACBCh. 2.8 - Prob. 2.125ACBCh. 2.8 - Lobster trap placement. Strategic placement of...Ch. 2.8 - Does elevation impact hitting performance in...Ch. 2.8 - Prob. 2.128ACBCh. 2.8 - Prob. 2.129ACBCh. 2.8 - Spreading rate of spilled liquid A contract...Ch. 2.8 - Performance ratings of government agencies. The...Ch. 2.8 - Most valuable NFL teams. Refer to the Forbes...Ch. 2.8 - Best-paid CEOs. Refer to Glassdoor Economic...Ch. 2.8 - Prob. 2.134ACACh. 2.10 - Museum management. Refer to the Museum Management...Ch. 2.10 - Volkswagen emissions scandal. Refer to the...Ch. 2.10 - BP oil leak. In the summer of 2010, an explosion...Ch. 2 - Construet a relative frequency histogram for the...Ch. 2 - Discuss the conditions under which the median is...Ch. 2 - Consider the following three measurements: 50, 70,...Ch. 2 - Refer to Exercise 2.141c. For parts a-d, determine...Ch. 2 - For each of the following data sets, compute x,...Ch. 2 - For each of the following data sets, compute x,...Ch. 2 - Explain why we generally prefer the standard...Ch. 2 - If the range of a set of data is 20, find a rough...Ch. 2 - Prob. 2.147LMCh. 2 - Motivation of drug dealers. Refer to the Applied...Ch. 2 - Slogs for Fortune 500 firms. Web site...Ch. 2 - Management system failures. The U.S. Chemical...Ch. 2 - Business marketing publications....Ch. 2 - U.S. business bankruptcies. The American...Ch. 2 - Prob. 2.153ACBCh. 2 - Products Made in the USA. Made in the USA is a...Ch. 2 - Prob. 2.155ACBCh. 2 - Drivers stopped by police. According to the Bureau...Ch. 2 - U.S. wine export markets. The Center for...Ch. 2 - Prob. 2.158ACICh. 2 - Hull failures of oil tankers. Owing to several...Ch. 2 - Software defects. The Promise Software Engineering...Ch. 2 - Prob. 2.161ACICh. 2 - Time to develop price quotes. A manufacturer of...Ch. 2 - Trend in Iraq War casualties. While the United...Ch. 2 - Prob. 2.164ACICh. 2 - Radiation levels in homes. In some locations,...Ch. 2 - Doctors and ethics. For physicians confronted with...Ch. 2 - Prob. 2.167ACICh. 2 - Investigating the claims of weight-loss clinics....Ch. 2 - Age discrimination study. The Age Discrimination...Ch. 2 - No Child Left Behind Act. According to the...Ch. 2 - Steel rod quality. In his essay Making Things...
Knowledge Booster


Learn more about
Need a deep-dive on the concept behind this application? Look no further. Learn more about this topic, statistics and related others by exploring similar questions and additional content below.Similar questions
- Weight 1.897 Cost 53.6 3.019 184.9 0.453 6.4 0.988 23.5 1.058 33.4 2.1 110.4 2.387 104.6 People at SpaceX Inc conducted a pilot study to determine the relationship between the weight and cost of a major object being sent into space. The results of the pilot study are contained in data file ASP.1, available in the LBRT #2 folder. Determine the number of observations needed to be 89% confident that the estimate of the average cost is within $15 of the overall mean cost. Note: Assume that the pilot study standard deviation is a good estimate of the population standard deviation, that an appropriate value from the Z-table can be used, and that hand calculations are used to find the answer (i.e. do not use Kaddstat).arrow_forwardHigh cholesterol is one of the major risk factors for heart disease. A total cholesterol reading above 190 mg/dL is considered high.A physician is concerned that a patient may be at risk for high cholesterol. In order to accurately measure the patient's average cholesterol level, the physician instructs the patient to come into the physician's office once a week for 12 weeks for a blood lipid screening. The results of the 12 measurements are listed below. 189 186 199 197 190 186 185 200 200 200 185 190 Use the critical value method to test the hypothesis that the patient's cholesterol level is greater than 190 mg/dL, using a significance level of 10%. Assume that the distribution of all cholesterol measurements from this patient is approximately normally distributed. Determine the critical value(s) for this hypothesis test. Round the solution(s) to four decimal places. If more than one critical value exists, enter the solutions using a comma-separated list.Determine the test…arrow_forwardCalcium is essential to tree growth because it promotes the formation of wood and maintains cell walls. In 1990, the concentration of calcium in precipitation in a certain area was 0.12 milligrams per liter (mg/L). A random sample of 10 precipitation dates in 2007 results in the following data table. Complete parts (a) through (c) below. Click the icon to view the data table. - Data table (a) State the hypotheses for determining if the mean concentration of calcium precipitation has changed since 1990. Ho: P = 0.12 mg/L H₁: μ # 0.12 mg/L 0.074 0.075 0.071 0.257 0.116 0.177 0.107 0.247 0.333 0.102 (b) Construct a 90% confidence interval about the sample mean concentration of calcium precipitation. The lower bound is The upper bound is Print (Round to four decimal places as needed.) Done Xarrow_forward
- Trace metals in drinking water affect the flavor and an unusually high concentration can pose a health hazard. Ten pairs of data were taken measuring zinc concentration in bottom water and surface water of a water source. Zinc Zinc concentration concentration in bottom Location in surface water water 1 .430 .415 .266 .238 3 .567 .390 4 .531 .410 .707 .605 .716 .609 7 .651 .632 8 .589 .523 .469 .411 10 .723 .612 Do the data support that the zinc concentration is less on the surface than the bottom of the water source, at the a = 0.1 level of significance? Note: A normal probability plot of difference in zinc concentration between the bottom and surface of water indicates the population could be normal and a boxplot indicated no outliers. a. Express the null and alternative hypotheses in symbolic form for this claim. Assume Ha = H1 – 12, where li is the population mean zinc concentration in the bottom of water and 42 is the mean zinc concentration in the surface of water. Ho: Ha Select…arrow_forwardArsenic is a chemical element that occurs in many minerals, usually in conjunction with sulfur and metals, and also as a pure elemental crystal. The main use of metallic arsenic is for strengthening alloys of copper and lead. Unfortunately, arsenic occurs in some ground water. In large quantities it is toxic for multicellular life. A mean arsenic level of 8 particles per billion (ppb) is considered safe for agricultural use. A well in Texas is used to water cotton crops. This well is tested regularly for arsenic. A random sample 37 tests gave a sample mean of 7.2 ppb arsenic with standard deviation of 1.9 ppb. Assume that arsenic levels are normally distributed. We are to use the sample data and test if mean arsenic level in the well in question is less than 8 ppb. a. Test statistic isb. The ? − value of the test isc. At the significance level calculated in part c), we conclude that mean arsenic level in thewell isarrow_forward"Durable press" cotton fabrics are treated to improve their recovery from wrinkles after washing. "Wrinkle recovery angle" measures how well a fabric recovers from wrinkles. Higher is better. Here are data on the wrinkle recovery angle (in degrees) for two types of treated fabrics: Permafresh 12 13 15 11 10 16 14 Hylite 14 19 20 16 A manufacturer wants to know how large is the difference in mean wrinkle recovery angle. Give a 98% confidence interval for the difference in mean wrinkle recovery angle: [three decimal accuracy] [three decimal accuracy]arrow_forward
- A plot of the residuals and frequencies is commonly called a Histogramarrow_forwardPeriodically, the county Water Department tests the drinking water of homeowners for contaminants such as lead and copper. The lead and copper levels in water specimens collected in 1998 for a sample of 10 residents of a subdevelopement of the county are shown below. lead (g/L) copper (mg/L) 2.9 0.2 5.1 4.2 5.5 1.2 0.3 1.3 4.9 1.7 0.133 0.774 0.214 0.671 0.444 0.234 0.357 0.761 0.176 0.888 (a) Construct a 99% confidence interval for the mean lead level in water specimans of the subdevelopment. OSASO (b) Construct a 99% confidence interval for the mean copper level in water specimans of the subdevelopment. ≤H≤arrow_forwardWaterbury Insurance Company wants to study the relationship between the amount of fire damage and the distance between the burning house and the nearest fire station. This information will be used in setting rates for insurance coverage. For a sample of 30 claims for the last year, the director of the actuarial department determined the distance from the fire station (x) and the amount of fire damage, in thousands of dollars (y). The MegaStat output is reported below. ANOVA table Source SS df MS F Regression 1,865.5782 1 1,865.5782 39.56 Residual 1,320.4934 28 47.1605 Total 3,186.0716 29 Regression output Variables Coefficients Std. Error t(df=28) Intercept 13.7523 3.0957 3.672 Distance–X 6.3449 1.0088 6.29 a-1. Write out the regression equation. (Round your answers to 3 decimal places.) a-2. Is there a direct or indirect relationship between the distance from the fire station and the amount of fire damage? How much damage would…arrow_forward
arrow_back_ios
arrow_forward_ios
Recommended textbooks for you
 Glencoe Algebra 1, Student Edition, 9780079039897...AlgebraISBN:9780079039897Author:CarterPublisher:McGraw Hill
 Big Ideas Math A Bridge To Success Algebra 1: Stu...AlgebraISBN:9781680331141Author:HOUGHTON MIFFLIN HARCOURTPublisher:Houghton Mifflin Harcourt
Glencoe Algebra 1, Student Edition, 9780079039897...
Algebra
ISBN:9780079039897
Author:Carter
Publisher:McGraw Hill
Big Ideas Math A Bridge To Success Algebra 1: Stu...
Algebra
ISBN:9781680331141
Author:HOUGHTON MIFFLIN HARCOURT
Publisher:Houghton Mifflin Harcourt
Hypothesis Testing using Confidence Interval Approach; Author: BUM2413 Applied Statistics UMP;https://www.youtube.com/watch?v=Hq1l3e9pLyY;License: Standard YouTube License, CC-BY
Hypothesis Testing - Difference of Two Means - Student's -Distribution & Normal Distribution; Author: The Organic Chemistry Tutor;https://www.youtube.com/watch?v=UcZwyzwWU7o;License: Standard Youtube License