
EP STATISTICS F/BUS.+ECON.-ACCESS 18 WK
13th Edition
ISBN: 9780135960912
Author: MCCLAVE
Publisher: PEARSON CO
expand_more
expand_more
format_list_bulleted
Videos
Textbook Question
Chapter 2.1, Problem 2.2LM
A qualitative variable with three classes (X, Y, and Z) is measured for each of 20 units randomly sampled from a target population. The data (observed class for each unit) are listed below.
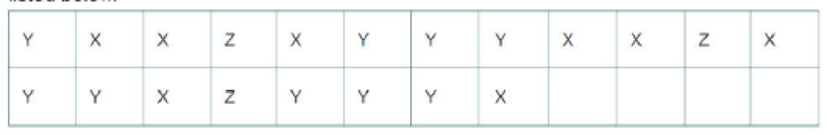
- a. Compute the frequency for each of the three classes.
- b. Compute the relative frequency for each of the three classes.
- c. Display the results, part a, in a frequency bar graph.
- d. Display the results, part b, in a pie chart.
Expert Solution & Answer
Want to see the full answer?
Check out a sample textbook solution
Students have asked these similar questions
True or False? A dot plot always reveals the exact data range, whether the sample size is large or small.
RDPct
13.5
8.4
10.5
9
9.2
9.7
6.6
10.6
10.1
7.1
8
7.9
6.8
9.5
8.1
13.5
9.9
6.9
7.5
11.1
8.2
8
7.7
7.4
6.5
9.5
8.2
6.9
7.2
8.2
9.6
7.2
8.8
11.3
8.5
9.4
10.5
6.9
6.5
7.5
7.1
13.2
7.7
5.9
5.2
5.6
11.7
6
7.8
6.5
The last digit of the heights of 67 statistics students were obtained as part of an
experiment conducted for a class. Use the following frequency distribution to construct a
histogram.
What can be concluded from the distribution of the digits? Specifically, do the heights
appear to be reported or actually measured?
Digit Frequency
0
15
5
5
1
T
Choose the correct histogram below.
O A.
O B.
O C.
D.
18-
56789
0123456789
ܩܫܠ
6789
123456789
Are the data reported or measured?
O A. The data appears to be measured. The heights occur
with roughly the same frequency.
O B. The data appears to be measured. Certain heights occur a
..
Chapter 2 Solutions
EP STATISTICS F/BUS.+ECON.-ACCESS 18 WK
Ch. 2.1 - Complete the following table.Ch. 2.1 - A qualitative variable with three classes (X, Y,...Ch. 2.1 - STEM experiences for girls. The National Science...Ch. 2.1 - Cable TV subscriptions and cord cutters. Has the...Ch. 2.1 - Do social robots walk or roll? A social (or...Ch. 2.1 - Top credit card issuers, by region. The Nilson...Ch. 2.1 - Microsoft program security issues. To help its...Ch. 2.1 - Jamming attacks on wireless networks. Refer to the...Ch. 2.1 - The Apprentice contestants performance ratings....Ch. 2.1 - The economic return to earning an MBA. Refer to...
Ch. 2.1 - Profiling UK rental malls. An analysis of the...Ch. 2.1 - History of corporate acquisitions. A corporate...Ch. 2.1 - Twitter opinions of iPhone 6 features. What are...Ch. 2.1 - Museum management. What criteria do museums use to...Ch. 2.1 - Advertising with reader-response cards....Ch. 2.1 - Motivation and right-oriented bias. Evolutionary...Ch. 2.1 - Groundwater contamination in wells. In New...Ch. 2.2 - Graph the relative frequency histogram for the 500...Ch. 2.2 - Refer to Exercise 2.18. Calculate the number of...Ch. 2.2 - Consider the stem-and-leaf display shown here. a....Ch. 2.2 - Minitab was used to generate the following...Ch. 2.2 - Stability of compounds in new drugs. Testing the...Ch. 2.2 - Corporate sustainability of CPA firms. Refer to...Ch. 2.2 - Sanitation inspection of cruise ships. To minimize...Ch. 2.2 - History of corporate acquisitions. Refer to the...Ch. 2.2 - Most valuable NFL teams. Each year Forbes reports...Ch. 2.2 - State SAT scores. Educators are constantly...Ch. 2.2 - Items arriving and departing a work center. In a...Ch. 2.2 - Crude oil biodegradation. In order to protect...Ch. 2.2 - Volkswagen emissions scandal. Recently, the...Ch. 2.2 - Is honey a cough remedy? Does a teaspoon of honey...Ch. 2.2 - Time in bankruptcy. Financially distressed firms...Ch. 2.2 - Prob. 2.33ACACh. 2.2 - Prob. 2.34ACACh. 2.3 - Calculate the mean and median of the following...Ch. 2.3 - Calculate the mean for samples where a. n = 10, x...Ch. 2.3 - Explain how the relationship between the mean and...Ch. 2.3 - Explain the difference between the calculation of...Ch. 2.3 - Calculate the mode, mean, and median of the...Ch. 2.3 - Calculate the mean, median, and mode for each of...Ch. 2.3 - Describe how the mean compares to the median for a...Ch. 2.3 - Use the applet entitled Mean versus Median to find...Ch. 2.3 - Prob. 2.2AECh. 2.3 - Use the applet Mean versus Median to study the...Ch. 2.3 - Hotels use of ecolabels. Ecolabels such as Energy...Ch. 2.3 - Rankings of research universities. Based on...Ch. 2.3 - Performance of stock screeners. Investment...Ch. 2.3 - Performance-based logistics. Refer to the Journal...Ch. 2.3 - Surface roughness of oil field pipe. Oil field...Ch. 2.3 - Prob. 2.47ACICh. 2.3 - Corporate sustainability of CPA firms. Refer to...Ch. 2.3 - Is honey a cough remedy? Refer to the Archives of...Ch. 2.3 - Crude oil biodegradation. Refer to the Journal of...Ch. 2.3 - Symmetric or skewed? Would you expect the data...Ch. 2.3 - Prob. 2.52ACICh. 2.3 - Prob. 2.53ACACh. 2.3 - Prob. 2.54ACACh. 2.3 - Prob. 2.55ACACh. 2.4 - Answer the following questions about variability...Ch. 2.4 - Calculate the range, variance, and standard...Ch. 2.4 - Calculate the variance and standard deviation for...Ch. 2.4 - Compute x,s2, and s for each of the following data...Ch. 2.4 - Calculate the range, variance, and standard...Ch. 2.4 - Using only integers between 0 and 10, construct...Ch. 2.4 - Using only integers between 0 and 10, construct...Ch. 2.4 - Consider the following sample of five...Ch. 2.4 - Use the applet entitled Standard Deviation to find...Ch. 2.4 - Use the applet Standard Deviation to study the...Ch. 2.4 - Use the applet Standard Deviation to study the...Ch. 2.4 - Hotels use of ecolabels. Refer to the Journal of...Ch. 2.4 - Permeability of sandstone during weathering. Refer...Ch. 2.4 - Performance of stock screeners. Refer to the...Ch. 2.4 - Corporate sustainability of CPA firms. Refer to...Ch. 2.4 - Is honey a cough remedy? Refer to the Archives of...Ch. 2.4 - Active nuclear power plants. Refer to Exercise...Ch. 2.4 - Estimating production time. A widely used...Ch. 2.5 - The output from a statistical software package...Ch. 2.5 - Prob. 2.72LMCh. 2.5 - For a set of data with a mound-shaped relative...Ch. 2.5 - The following is a sample of 25 measurements: a....Ch. 2.5 - Given a data set with a largest value of 760 and a...Ch. 2.5 - Voltage sags and swells. The power quality of a...Ch. 2.5 - Permeability of sandstone during weathering. Refer...Ch. 2.5 - Do social robots walk or roll? Refer to the...Ch. 2.5 - College dropout study. The American Economic...Ch. 2.5 - Motivation of drug dealers. Consider a study of...Ch. 2.5 - Sanitation inspection of cruise ships. Refer to...Ch. 2.5 - Volkswagen emissions scandal. Refer to the...Ch. 2.5 - Auditing water resources in Australia. Australia...Ch. 2.5 - The Apprentice contestants performance ratings....Ch. 2.5 - Shopping vehicle and judgment. While shopping at...Ch. 2.5 - Buy-side vs. sell-side analysts earnings...Ch. 2.5 - Prob. 2.87ACACh. 2.5 - Improving SAT scores. The National Education...Ch. 2.5 - Prob. 2.89ACACh. 2.6 - Compute the z-score corresponding to each of the...Ch. 2.6 - Give the percentage of measurements in a data set...Ch. 2.6 - In terms of percentiles, define QL, QM and QU.Ch. 2.6 - Compare the z-scores to decide which of the...Ch. 2.6 - Suppose that 40 and 90 are two elements of a...Ch. 2.6 - Mathematics assessment test scores. According to...Ch. 2.6 - Prob. 2.96ACBCh. 2.6 - Prob. 2.97ACBCh. 2.6 - Sanitation inspection of cruise ships Refer to the...Ch. 2.6 - Prob. 2.99ACICh. 2.6 - Prob. 2.100ACICh. 2.6 - Executive networking and firm performance. Do...Ch. 2.6 - Blue- vs. red-colored exam study. In a study of...Ch. 2.6 - Ranking PhD programs in economics. Thousands of...Ch. 2.6 - Using z-scores for grades. At one university, the...Ch. 2.6 - Prob. 2.105ACACh. 2.7 - A sample data set has a mean of 57 and a standard...Ch. 2.7 - Suppose a data set consisting of exam scores has a...Ch. 2.7 - Consider the horizontal box plot shown below. a....Ch. 2.7 - Prob. 2.109LMCh. 2.7 - Prob. 2.7AECh. 2.7 - Rankings of research universities. Refer to the...Ch. 2.7 - Voltage sags and swells. Refer to the Electrical...Ch. 2.7 - Treating psoriasis with the Doctorfish of Kangal....Ch. 2.7 - Budget lapsing at army hospitals. Accountants use...Ch. 2.7 - Salary offers to MBAs. Consider the top salary...Ch. 2.7 - Prob. 2.115ACICh. 2.7 - Prob. 2.116ACICh. 2.7 - Sanitation inspection of cruise ships. Referto...Ch. 2.7 - Network server downtime. A manufacturer of network...Ch. 2.7 - Permeability of sandstone during weathering. Refer...Ch. 2.7 - Prob. 2.120ACACh. 2.7 - Prob. 2.121ACACh. 2.8 - Construct a scatterplot for the data in the...Ch. 2.8 - Construct a scatterplot for the data in the...Ch. 2.8 - Prob. 2.124ACBCh. 2.8 - Prob. 2.125ACBCh. 2.8 - Lobster trap placement. Strategic placement of...Ch. 2.8 - Does elevation impact hitting performance in...Ch. 2.8 - Prob. 2.128ACBCh. 2.8 - Prob. 2.129ACBCh. 2.8 - Spreading rate of spilled liquid A contract...Ch. 2.8 - Performance ratings of government agencies. The...Ch. 2.8 - Most valuable NFL teams. Refer to the Forbes...Ch. 2.8 - Best-paid CEOs. Refer to Glassdoor Economic...Ch. 2.8 - Prob. 2.134ACACh. 2.10 - Museum management. Refer to the Museum Management...Ch. 2.10 - Volkswagen emissions scandal. Refer to the...Ch. 2.10 - BP oil leak. In the summer of 2010, an explosion...Ch. 2 - Construet a relative frequency histogram for the...Ch. 2 - Discuss the conditions under which the median is...Ch. 2 - Consider the following three measurements: 50, 70,...Ch. 2 - Refer to Exercise 2.141c. For parts a-d, determine...Ch. 2 - For each of the following data sets, compute x,...Ch. 2 - For each of the following data sets, compute x,...Ch. 2 - Explain why we generally prefer the standard...Ch. 2 - If the range of a set of data is 20, find a rough...Ch. 2 - Prob. 2.147LMCh. 2 - Motivation of drug dealers. Refer to the Applied...Ch. 2 - Slogs for Fortune 500 firms. Web site...Ch. 2 - Management system failures. The U.S. Chemical...Ch. 2 - Business marketing publications....Ch. 2 - U.S. business bankruptcies. The American...Ch. 2 - Prob. 2.153ACBCh. 2 - Products Made in the USA. Made in the USA is a...Ch. 2 - Prob. 2.155ACBCh. 2 - Drivers stopped by police. According to the Bureau...Ch. 2 - U.S. wine export markets. The Center for...Ch. 2 - Prob. 2.158ACICh. 2 - Hull failures of oil tankers. Owing to several...Ch. 2 - Software defects. The Promise Software Engineering...Ch. 2 - Prob. 2.161ACICh. 2 - Time to develop price quotes. A manufacturer of...Ch. 2 - Trend in Iraq War casualties. While the United...Ch. 2 - Prob. 2.164ACICh. 2 - Radiation levels in homes. In some locations,...Ch. 2 - Doctors and ethics. For physicians confronted with...Ch. 2 - Prob. 2.167ACICh. 2 - Investigating the claims of weight-loss clinics....Ch. 2 - Age discrimination study. The Age Discrimination...Ch. 2 - No Child Left Behind Act. According to the...Ch. 2 - Steel rod quality. In his essay Making Things...
Knowledge Booster


Learn more about
Need a deep-dive on the concept behind this application? Look no further. Learn more about this topic, statistics and related others by exploring similar questions and additional content below.Similar questions
- Please solve the second image.arrow_forwardConsider the following frequency distribution:Class Frequency0 < 10 810 < 20 1020 < 30 1330 < 40 1240 < 50 6a. Construct a relative frequency distribution.b. Construct a cumulative frequency distribution.c. Construct a cumulative relative frequency distribution.arrow_forwardA rectangle is a four-sided figure that has two sets of parallel sides, so that we have two sides of one length and two sides of another length; a square is just a special case of a rectangle in which all four sides are the same length. Therefore, the procedure for calculating area is the same no matter whether we are dealing with a rectangle or a square. The area of a rectangle is calculated as follows: Area = base x height = b × h In this formula, the base is the width of the rectangle and the height is simply how tall the rectangle Is. For example, if we have a rectangle that is 20 centimeters wide and 10 centimeters tall, its area can be calculated as follows: Area = 20 cm x 10 cm = 200 cm² Note the superscript '2' In our answer; this is because we have multiplied centimeters by centimeters. In economics, we are more likely to be dealing with quantities bought or sold and prices, so don't worry about it too much for our discussion. The area of a triangle A triangle is really just a…arrow_forward
- A rectangle is a four-sided figure that has two sets of parallel sides, so that we have two sides of one length and two sides of another length; a square is just a special case of a rectangle in which all four sides are the same length. Therefore, the procedure for calculating area is the same no matter whether we are dealing with a rectangle or a square. The area of a rectangle is calculated as follows: Area = base x height = b × h In this formula, the base is the width of the rectangle and the height is simply how tall the rectangle Is. For example, if we have a rectangle that is 20 centimeters wide and 10 centimeters tall, its area can be calculated as follows: Area = 20 cm x 10 cm = 200 cm² Note the superscript '2' In our answer; this is because we have multiplied centimeters by centimeters. In economics, we are more likely to be dealing with quantities bought or sold and prices, so don't worry about it too much for our discussion. The area of a triangle A triangle is really just a…arrow_forwardA rectangle is a four-sided figure that has two sets of parallel sides, so that we have two sides of one length and two sides of another length; a square is just a special case of a rectangle in which all four sides are the same length. Therefore, the procedure for calculating area is the same no matter whether we are dealing with a rectangle or a square. The area of a rectangle is calculated as follows: Area = base x height = b × h In this formula, the base is the width of the rectangle and the height is simply how tall the rectangle Is. For example, if we have a rectangle that is 20 centimeters wide and 10 centimeters tall, its area can be calculated as follows: Area = 20 cm x 10 cm = 200 cm² Note the superscript '2' In our answer; this is because we have multiplied centimeters by centimeters. In economics, we are more likely to be dealing with quantities bought or sold and prices, so don't worry about it too much for our discussion. The area of a triangle A triangle is really just a…arrow_forwardA political pollster wants to ensure that their poll on attitudes toward separation of church and state gets responses from all major religious groups. What kind of sampling method should be used?arrow_forward
- A rectangle is a four-sided figure that has two sets of parallel sides, so that we have two sides of one length and two sides of another length; a square is just a special case of a rectangle in which all four sides are the same length. Therefore, the procedure for calculating area is the same no matter whether we are dealing with a rectangle or a square. The area of a rectangle is calculated as follows: Area = base x height = b × h In this formula, the base is the width of the rectangle and the height is simply how tall the rectangle Is. For example, if we have a rectangle that is 20 centimeters wide and 10 centimeters tall, its area can be calculated as follows: Area = 20 cm x 10 cm = 200 cm² Note the superscript '2' In our answer; this is because we have multiplied centimeters by centimeters. In economics, we are more likely to be dealing with quantities bought or sold and prices, so don't worry about it too much for our discussion. The area of a triangle A triangle is really just a…arrow_forwardConsider the following data: −9,13,−14,−14,−9,−14,−9−9,13,−14,−14,−9,−14,−9 Copy Data Step 3 of 3: Calculate the value of the range.arrow_forwardThe birthweight (in kg) of 55 babies are tabulated in the frequency distribution below: Birthweight (kg) Class Midpoint Frequency M (1– 1.5| (1.5-2 1.25 6. 1.75 10 (2- 2.5) 2.25 1 (2.5-3) 2.75 15 10 (3-3.5] 3.25 3. (3.5- 4) 3.75 55 Total Calculate the relative frequency of the class interval (2 - 2.5).arrow_forward
arrow_back_ios
SEE MORE QUESTIONS
arrow_forward_ios
Recommended textbooks for you

 Principles of Economics (12th Edition)EconomicsISBN:9780134078779Author:Karl E. Case, Ray C. Fair, Sharon E. OsterPublisher:PEARSON
 Engineering Economy (17th Edition)EconomicsISBN:9780134870069Author:William G. Sullivan, Elin M. Wicks, C. Patrick KoellingPublisher:PEARSON
 Principles of Economics (MindTap Course List)EconomicsISBN:9781305585126Author:N. Gregory MankiwPublisher:Cengage Learning
 Managerial Economics: A Problem Solving ApproachEconomicsISBN:9781337106665Author:Luke M. Froeb, Brian T. McCann, Michael R. Ward, Mike ShorPublisher:Cengage Learning
 Managerial Economics & Business Strategy (Mcgraw-...EconomicsISBN:9781259290619Author:Michael Baye, Jeff PrincePublisher:McGraw-Hill Education
Principles of Economics (12th Edition)
Economics
ISBN:9780134078779
Author:Karl E. Case, Ray C. Fair, Sharon E. Oster
Publisher:PEARSON
Engineering Economy (17th Edition)
Economics
ISBN:9780134870069
Author:William G. Sullivan, Elin M. Wicks, C. Patrick Koelling
Publisher:PEARSON
Principles of Economics (MindTap Course List)
Economics
ISBN:9781305585126
Author:N. Gregory Mankiw
Publisher:Cengage Learning
Managerial Economics: A Problem Solving Approach
Economics
ISBN:9781337106665
Author:Luke M. Froeb, Brian T. McCann, Michael R. Ward, Mike Shor
Publisher:Cengage Learning
Managerial Economics & Business Strategy (Mcgraw-...
Economics
ISBN:9781259290619
Author:Michael Baye, Jeff Prince
Publisher:McGraw-Hill Education
How to make Frequency Distribution Table / Tally Marks and Frequency Distribution Table; Author: Reenu Math;https://www.youtube.com/watch?v=i_A6RiE8tLE;License: Standard YouTube License, CC-BY
Frequency distribution table in statistics; Author: Math and Science;https://www.youtube.com/watch?v=T7KYO76DoOE;License: Standard YouTube License, CC-BY
Frequency Distribution Table for Grouped/Continuous data | Math Dot Com; Author: Maths dotcom;https://www.youtube.com/watch?v=ErnccbXQOPY;License: Standard Youtube License