Concept explainers
Videos
To review:
The relationship between the number of synonymous substitutions and the years of divergence between each pair of species, with the help of a graph. Also, estimate the rates of synonymous substitutions per million years and per generation for the complete axon on a per-site basis.
Given:
In the given study, a hypothetical gene encodes for the transcription factor in various species of Drosophila. According to the diagram (Figure 1) given below, one exon of this gene is sequenced in four species.
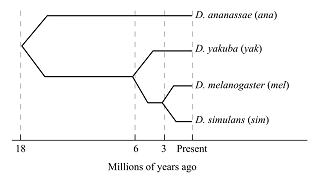
Figure 1: Million of years ago.
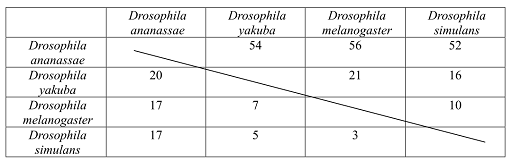
The matrix shows the number of synonymous and nonsynonymous substitutions between pairs of different Drosophila species, which evolved as a result of evolution. There are 2,000 nonsynonymous and 600 synonymous substitutions sites of the exon (Figure 2).
Figure 2: Matrix showing the number of synonymous and nonsynonymous substitutions between pairs of species of Drosophila.
Introduction:
Biologists are able to make inference about the type of natural selection, by the study based on molecular evolutionary patterns of genes. These inferences are important to know, about the gene functioning and how they evolve over the time, in response to the new function and conditions.
Explanation of Solution
According to the given analysis, there are, on an average, 54 synonymous substitutions occurs between the lineages. These lineages were diverged 18 million years ago. So, there are about 1.5 synonymous substitutions per million year for the entire exon.
Therefore, the information used for calculation of the rate is:
Time period: 18 million years ago
Substitution per million years: 1.5
Lineages: 2
Generation per year: 5
Synonymous sites: 600
Thus, for rate of substitution per generation is:
90,000,000 years
Similarly, the rate of substitution per site is:
(90,000,000 years
Graph given below shows number of substitution along with millions of years.
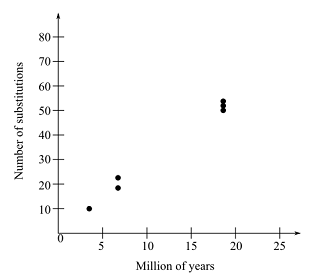
Therefore, it can be concluded that the rates are 3
Want to see more full solutions like this?
Chapter 23 Solutions
LIFE: THE SCIENCE OF BIOLOGY


- Suppose species 1, 2, and 3 are endemic to a group of islands (such as the Galápagos) and are all descended from species 4, an outgroup. We sequence a gene and find ten nucleotide sites that differ among the four species (among many other loci that do not vary). The nucleotide bases at these sites are Species 1: GCTGATGAGT Species 2: ATCAATGAGT Species 3: GTTGCAACGT Species 4: GTCAATGACA Estimate the phylogeny of these taxa by plotting the changes on each of the three possible trees and determine which tree requires the fewest evolutionary changes. (Please answer including what are 3 possible trees.? )arrow_forwardA researcher studying two species (species 1 and species 2) sequences a short stretch of eight codons from the same gene, gene B, in each and compares them. Species 1 and species 2 had a most recent common ancestor 50 million years ago. Species 1: ATC GGG CGG GAC TTA CTA TAT GCC Species 2: ATT GGG CGG GAC TTG CTA TAT GCC Given the differences between the sequences of the two species' genes shown here, what evolutionary force can you predict is most likely in operation on gene B?arrow_forwardWhat is maximum likelihood (ML) in phylogenetics? The probability of the model of sequence evolution given the tree, the sequences, and the branch lengths O The probability of the tree given the sequences, the model of sequence evolution, and the branch lengths O The probability of the branch lengths given the sequences, the tree, and the model of sequence evolution O The probability of the sequences given the tree, the model of sequence evolution, and the branch lengthsarrow_forward
- Molecular marker is used to determine relatedness of species which may directly or indirectly exerts an effect on diversity. A hypothetical ancestor has the following DNA sequences: G A A G C T A T T C A T T. There are two lineage with DNA sequences of G A A G G T A T T C T C G, and G A A C C T A T T C T G C. (1) Determine the percentage of A and T in the DNA sequence of the hypothetical ancestor. (2) Calculate the percentage of each nitrogenous base in the second lineage.arrow_forwardSuppose species 1, 2, and 3 are endemic to a group of islands (such as the Galápagos) and are all descended from species 4 on the mainland (which will serve as an outgroup; its large population size means that no new mutations have become fixed in its population in the time since the islands were colonized). You sequence a gene and find ten nucleotide sites that differ among the four species (among many other loci that do not vary). The nucleotide bases at these sites are: Species 1: GCTGATGAGT Species 2: ATCAATGAGT Species 3: GTTGCAACGT Species 4: GTCAATGACA Estimate the phylogeny of these taxa by plotting the changes on each of the three possible unrooted trees and determining which tree requires the fewest evolutionary changes.arrow_forwardSpecies A, B, and C are related according to the phylogeny below (A,(B,C)). Species A and C diverged 10,000,000 generations ago, and species B and C diverged 100,000 generations ago. All three species are diploids. The mutation rate in their genomes is 1×10⁻⁹ mutations per basepair per generation. A gene found in all three species is 1,000 bp long. 75% of mutations in the gene are deleterious and 0% are beneficial. Use this information to answer the following questions. a) If there are 20 polymorphic synonymous sites in the gene in species A, how many non-synonymous sites do you expect to be polymorphic? Assume all synonymous changes are neutral. b) In species B, there are an average of two pairwise differences between individuals within the gene. What is the effective population size of species B? c) What do you expect FST to be between species B and C? Assume no migration between the species after they diverged.arrow_forward
- Species A, B, and C are related according to the phylogeny below (A,(B,C)). Species A and C diverged 10,000,000 generations ago, and species B and C diverged 100,000 generations ago. All three species are diploids. The mutation rate in their genomes is 1×10⁻⁹ mutations per basepair per generation. A gene found in all three species is 1,000 bp long. 75% of mutations in the gene are deleterious and 0% are beneficial. Use this information to answer the following questions. a) Species A has 100,000 diploid individuals. How many new mutations arise per basepair per generation in species A? b) What is the gene’s neutral mutation rate per basepair per generation? c) What is the expected rate of fixation of neutral mutations in the gene? d) How many neutral substitution do you expect to observe if you compared the gene between species A and C?arrow_forwardA fossil believed to be the most recent common ancestor between housecats and lions is radio-dated to about 11 million years ago (mya). An analysis of a neutral section of mitochondrial DNA in both species finds 15 DNA base pair differences between the two cats today. Meanwhile, an analysis of housecats and pumas shows 4 DNA base pair differences between them, which are believed to have diverged around 3 mya. Using this data, what is the best estimate of the time since divergence of housecats and lynx, which have 11 DNA base pair differences in this mitochondrial DNA region? 5 mya O6 mya O 7 mya O8 mya 9 myaarrow_forwardHorse - Equus caballus Trace its origin and evolutionary history or changes in the species. Describe its structures and their functions. What is the importance of this species to our environment? Give trivia about this species. Does this organism produce oxygen? Explain. What are the ancestral species of your chosen organism? Has this species been genetically engineered? If yes, in what way? How does this species reproduce? What organisms have similar structures to this species? Do these structures have the same function? Does the species have tissues, organs, and/or organ systems? What is its role in the flow of energy? Give at 15 least a sentence to each question.arrow_forward
- (top or bottom) Species A, B, C, D, and, E are all extant species (living today; not to be confused with “extinct” species). Consider the common ancestor shared between humans and species A (ancestor A-H), the common ancestor between species B and humans (ancestor B-H), etc. Which of thetwo trees below best represents the phylogenetic relationship between species shown in the nucleotide divergence plot above (top tree or bottom tree)?arrow_forwardJust as anatomical homology can lead to vestigial structuressuch as human wisdom teeth and the wings of flightlessbirds, genetic homology can lead to vestigial DNA sequences.For example, most mammal species produce an enzyme,L-gulonolactone oxidase, that catalyzes the last step in the productionof vitamin C. The species that produce the enzyme areable to do so because they all inherited the gene that encodesit from a common ancestor. Humans, however, do not produceL-gulonolactone oxidase, so we can’t produce vitamin C ourselvesand must consume it in our diets. But even though wedon’t produce the enzyme, our cells do contain a stretch of DNAwith a sequence very similar to that of the enzyme-producinggene present in rats and most other mammals. The human version,though, does not encode the enzyme (or any protein). Weinherited this stretch of DNA from an ancestor that we share withother mammal species, but in us, the sequence has undergonea change that rendered it nonfunctional. (The…arrow_forwardPhylogenetic with branch lengths scaled in genetic distance 0.88 0.88 0.93 0.78 2388-3883 232 2002 4⁹29930 9823-2883 0.8 0.82 0.89- Mycobacterium tuberculosis Lineage 2 0.99 2001 90-2004 4484 2005 -0.635 388627805 718356883 11 2002 -83331-9811 74333-2690 $250-2010 10737 2002 203 2001 1511 208201 4701810 2008-2011 6295 29889 8073_2007 0.01 (# substitutions/nucleotide site) 83922889 015 2005 98507_2009 8195 200 46828000 Root-to-tip distance Evolutionary distance from root-to-tip versus sampling time 2.8x10 2.2x10 R²=0.00 1990 1995 2000 00 000 80 2005 000 O oo XBOO8 1. In this figure you can see a phylogenetic tree of samples of Mycobacterium tuberculosis lineage 2 and a corresponding root-to-tip plot. The branch lengths in the tree are scaled by evolutionary/genetic distance, so not by time. In the plot on the right, the summed branch lengths going from the root to the tips of the trees are then plotted against the dates the tips were sampled. What can we conclude from these figures? The…arrow_forward
 Human Anatomy & Physiology (11th Edition)BiologyISBN:9780134580999Author:Elaine N. Marieb, Katja N. HoehnPublisher:PEARSON
 Biology 2eBiologyISBN:9781947172517Author:Matthew Douglas, Jung Choi, Mary Ann ClarkPublisher:OpenStax
 Anatomy & PhysiologyBiologyISBN:9781259398629Author:McKinley, Michael P., O'loughlin, Valerie Dean, Bidle, Theresa StouterPublisher:Mcgraw Hill Education,
 Molecular Biology of the Cell (Sixth Edition)BiologyISBN:9780815344322Author:Bruce Alberts, Alexander D. Johnson, Julian Lewis, David Morgan, Martin Raff, Keith Roberts, Peter WalterPublisher:W. W. Norton & Company
 Laboratory Manual For Human Anatomy & PhysiologyBiologyISBN:9781260159363Author:Martin, Terry R., Prentice-craver, CynthiaPublisher:McGraw-Hill Publishing Co.
 Inquiry Into Life (16th Edition)BiologyISBN:9781260231700Author:Sylvia S. Mader, Michael WindelspechtPublisher:McGraw Hill Education