
Concept explainers
Videos
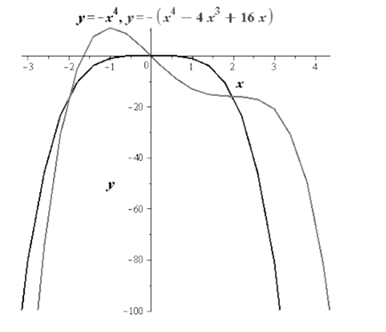
Plot the graph of the functions
Answer to Problem 31E
Graph is shown below
Explanation of Solution
Given:
The functions:
Draw the graph of two functions,
To compare the left- and right-hand behavior of the functions.
The graph of the two functions is,
Leading coefficient test
If without bound movement of
1. If n is odd, the curve of graph falls to left and it rises towards right if the leading coefficient is positive. Similarly, if leading coefficient value is negative, then the curve rises towards left and falls in the right.
2. If n is even, the curve of graph rises towards left in the positive leading coefficient value and the curve of graph falls towards the left and right in the negative leading coefficient value.
As, both the functions have the same degree and leading coefficients. So, from the leading coefficient test, both the functions will show left and right behavior.
Chapter 2 Solutions
EBK PRECALCULUS W/LIMITS


 Calculus: Early TranscendentalsCalculusISBN:9781285741550Author:James StewartPublisher:Cengage Learning
 Thomas' Calculus (14th Edition)CalculusISBN:9780134438986Author:Joel R. Hass, Christopher E. Heil, Maurice D. WeirPublisher:PEARSON
 Calculus: Early Transcendentals (3rd Edition)CalculusISBN:9780134763644Author:William L. Briggs, Lyle Cochran, Bernard Gillett, Eric SchulzPublisher:PEARSON
 Calculus: Early TranscendentalsCalculusISBN:9781319050740Author:Jon Rogawski, Colin Adams, Robert FranzosaPublisher:W. H. Freeman
 Calculus: Early Transcendental FunctionsCalculusISBN:9781337552516Author:Ron Larson, Bruce H. EdwardsPublisher:Cengage Learning