FINANCIAL ACCOUNTING
10th Edition
ISBN: 9781259964947
Author: Libby
Publisher: MCG
expand_more
expand_more
format_list_bulleted
Concept explainers
Topic Video
Question
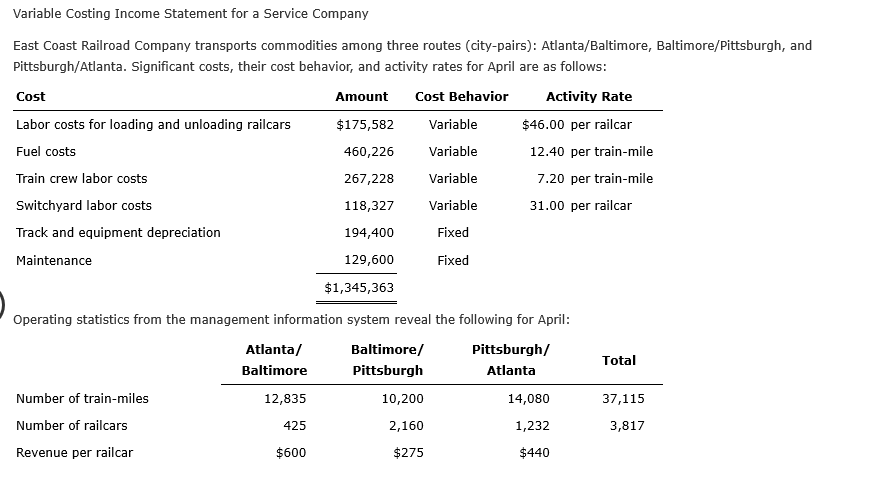
Variable Costing Income Statement for a Service Company
East Coast Railroad Company transports commodities among three routes (city-pairs): Atlanta/Baltimore, Baltimore/Pittsburgh, and Pittsburgh/Atlanta. Significant costs, their cost behavior, and activity rates for April are as follows:

Transcribed Image Text:Variable Costing Income Statement for a Service Company
East Coast Railroad Company transports commodities among three routes (city-pairs): Atlanta/Baltimore, Baltimore/Pittsburgh, and
Pittsburgh/Atlanta. Significant costs, their cost behavior, and activity rates for April are as follows:
Cost Behavior
Activity Rate
Cost
Amount
Labor costs for loading and unloading railcars
$175,582
Variable
$46.00 per railcar
Variable
12.40 per train-mile
Fuel costs
460,226
Train crew labor costs
Variable
7.20 per train-mile
267,228
31.00 per railcar
Switchyard labor costs
Variable
118,327
Track and equipment depreciation
Fixed
194,400
Maintenance
129,600
Fixed
$1,345,363
Operating statistics from the management information system reveal the following for April:
Atlanta/
Baltimore/
Pittsburgh/
Total
Baltimore
Pittsburgh
Atlanta
Number of train-miles
12,835
10,200
14,080
37,115
Number of railcars
425
2,160
1,232
3,817
Revenue per railcar
$600
$275
$440

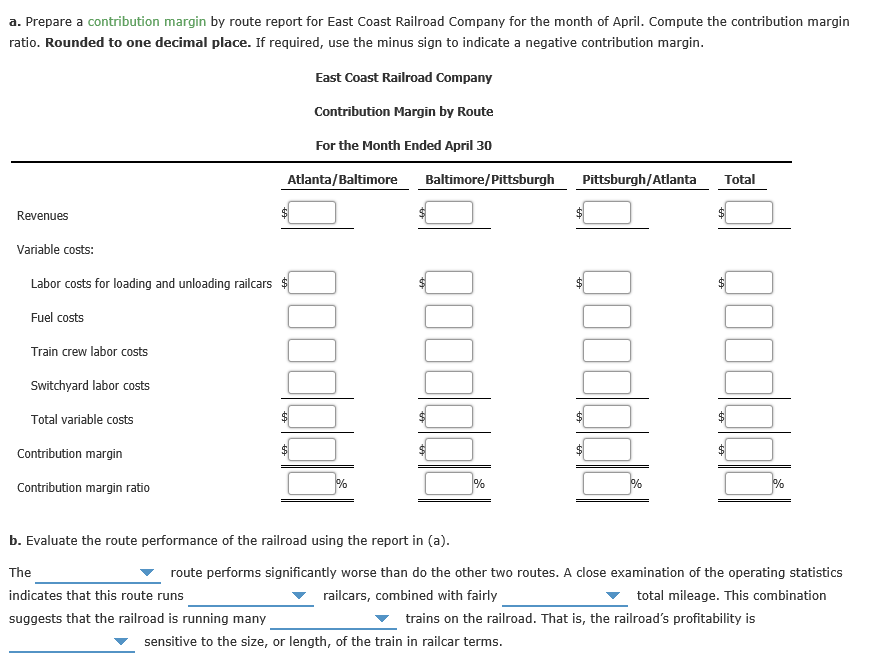
Transcribed Image Text:a. Prepare a contribution margin by route report for East Coast Railroad Company for the month of April. Compute the contribution margin
ratio. Rounded to one decimal place. If required, use the minus sign to indicate a negative contribution margin.
East Coast Railroad Company
Contribution Margin by Route
For the Month Ended April 30
Atlanta/Baltimore
Baltimore/Pittsburgh
Pittsburgh/Atlanta
Total
Revenues
Variable costs:
Labor costs for loading and unloading railcars $
Fuel costs
Train crew labor costs
Switchyard labor costs
Total variable costs
Contribution margin
%
Contribution margin ratio
b. Evaluate the route performance of the railroad using the report in (a).
The
route performs significantly worse than do the other two routes. A close examination of the operating statistics
indicates that this route runs
railcars, combined with fairly
total mileage. This combination
suggests that the railroad is running many
trains on the railroad. That is, the railroad's profitability is
sensitive to the size, or length, of the train in railcar terms.
QOodddi
Expert Solution
This question has been solved!
Explore an expertly crafted, step-by-step solution for a thorough understanding of key concepts.
This is a popular solution
Trending nowThis is a popular solution!
Step by stepSolved in 3 steps with 2 images

Knowledge Booster
Learn more about
Need a deep-dive on the concept behind this application? Look no further. Learn more about this topic, accounting and related others by exploring similar questions and additional content below.Similar questions
- A department of Delta Company incurred the following costs for the month of June. Variable costs, and the variable portion of mixed costs, are a function of the number of units of activity: Activity level in units Variable costs Fixed costs Mixed costs Total costs During July, the activity level was 9,000 units, and the total costs incurred were $69,000. Required: a. Calculate the variable costs, fixed costs, and mixed costs incurred during July. b. Use the high-low method to calculate the cost formula for mixed cost. Complete this question by entering your answers in the tabs below. Required A Required B 4,500 $ 8,100 30,000 20,800 $ 58,900 Calculate the variable costs, fixed costs, and mixed costs incurred during July. Variable cost Fixed cost Mixed cost Julyarrow_forwardPlease give me correct answerarrow_forward1. COMPUTE THE UNIT PRODUCT COST UNDER ABSORPTION COSTING 2. COMPUTE THE UNIT PRODUCT COST UNDER VARIABLE COSTINGarrow_forward
- Variable and Absorption Costing-Service CompanyReally BC, Inc. prepares a variable costing income statement for internal management and an absorption costing income statement for its bank. Really BC provides a quarterly lawn care service that is sold for $190. The variable and fixed cost data are as follows: Direct labor $100.00 Overhead Variable cost per unit $33.00 Fixed cost (annual) $100,000 Marketing, general and administrative Variable cost (per service contract completed) $34.00 Administrative expenses (fixed- annual cost) $42,000 During 2016, 10,000 service contracts were signed and 9,500 service contracts were completed. Lawn RX had no service contracts at the beginning of the year. a. Calculate reported income for management.Do not use negative signs with any answers. Absorption Costing Income Statement Sales Answer Cost of Goods Sold: Beginning Inventory Answer Variable…arrow_forwardVariable Costing Income Statement On April 30, the end of the first month of operations, Joplin Company prepared the following income statement, based on the absorption costing concept: Joplin CompanyAbsorption Costing Income StatementFor the Month Ended April 30 Sales (6,600 units) $178,200 Cost of goods sold: Cost of goods manufactured (7,700 units) $146,300 Inventory, April 30 (1,100 units) (20,900) Total cost of goods sold (125,400) Gross profit $52,800 Selling and administrative expenses (32,280) Operating income $20,520 If the fixed manufacturing costs were $39,501 and the fixed selling and administrative expenses were $15,810, prepare an income statement according to the variable costing concept. Round all final answers to whole dollars. Joplin CompanyVariable Costing Income StatementFor the Month Ended April 30 $Sales Variable cost of goods sold: $Variable cost of goods manufactured…arrow_forwardIncome Statements under Absorption Costing and Variable Costing Fresno Industries Inc. manufactures and sells high-quality camping tents. The company began operations on January 1 and operated at 100% of capacity (70,400 units) during the first month, creating an ending inventory of 6,400 units. During February, the company produced 64,000 units during the month but sold 70,400 units at $90 per unit. The February manufacturing costs and selling and administrative expenses were as follows: Manufacturing costs in February 1 beginning inventory: Variable Fixed Total Manufacturing costs in February: Variable Fixed Total Selling and administrative expenses in February: Variable Fixed Total Number of Units Cost of goods sold: 6,400 $36.00 6,400 14.00 64,000 64,000 Unit Cost 70,400 70,400 Total Cost $230,400 89,600 $50.00 $320,000 $36.00 $2,304,000 15.40 985,600 $51.40 $3,289,600 $18.20 $1,281,280 7.00 492,800 $25.20 $1,774,080 a. Prepare an income statement according to the absorption…arrow_forward
- A company is considering two mutually exclusive investments with a discount rate of 10%.The cash flows of the projects over time follows: Time Project A Project B 0 - RM300,000 - RM405,000 1 - RM387,000 RM134,000 2 - RM193,000 RM134,000 3 - RM100,000 RM134,000 4 RM600,000 RM134,000 5 RM600,000 RM134,000 6 RM850,000 RM134,000 7 - RM180,000 RM0 Net Present value given : Time Project A Project B Project A Project B 0 -300,000 -405,000 1.0000 (300,000.00) (405,000.00) 1 -387,000 134,000 0.9091 (351,818.18) 121,818.18 2 -193,000 134,000 0.8264 (159,504.13) 110,743.80 3 -100,000 134,000 0.7513 (75,131.48) 100,676.18 4 600,000 134,000 0.6830 409,808.07 91,523.80 5 600,000 134,000 0.6209 372,552.79 83,203.46 6 850,000 134,000 0.5645 479,802.84 75,639.51 7 -180,000 0 0.5132…arrow_forwardProvide correct solutionarrow_forwardIncome Statements under Absorption Costing and Variable Costing Gallatin County Motors Inc. assembles and sells snowmobile engines. The company began operations on July 1 and operated at 100% of capacity during the first month. The following data summarize the results for July: Sales (4,000 units) $2,600,000 Production costs (4,350 units): Direct materials Direct labor Variable factory overhead Fixed factory overhead Selling and administrative expenses: Variable selling and administrative expenses Fixed selling and administrative expenses Sales a. Prepare an income statement according to the absorption costing concept. Gallatin County Motors Inc. Absorption Costing Income Statement For the Month Ended July 31 $ 2,600,000 Cost of goods sold Gross profit 1,800,000 $1,218,000 522,000 87,000 130,500 1,957,500 $ 800,000 $60,000 25,000 85,000arrow_forward
- FastTrack Inc. manufactures and sells 50-inch television sets and uses standard costing. Actual data relating to January, February, and March are as follows. (Click to view the data.) The selling price per unit is $3,600. Required 1. Present statements of comprehensive income for January, February, and March under (a) variable costing and (b) absorption costing. 2. Explain the difference in operating income for January, February, and March under variable costing and absorption costing. Requirement 1a. Present statements of comprehensive income for January, February, and March unde Complete the top half of the statement of comprehensive income for each month first, and then complet January February Revenue Variable costs: Beginning inventory Variable manufacturing costs Allocated fixed manufacturing costs Less: Ending inventory Variable cost of goods sold Variable operating costs Data table Unit data: Beginning inventory Production Sales Variable costs: Print $ 0 1,000 950 Manufacturing…arrow_forwardVariable Costing Income Statement On April 30, the end of the first month of operations, Jopl Company prepared the following income statement, based on the absorption costing concept: Joplin Company Absorption Costing Income Statement For the Month Ended April 30 Sales (4,600 units) Cost of goods sold: Cost of goods manufactured (5,200 units) Inventory, April 30 (700 units) Total cost of goods sold Gross profit Selling and administrative expenses Operating income Joplin Company Variable Costing Income Statement For the Month Ended April 30 Variable cost of goods sold: If the fixed manufacturing costs were $29,484 and the fixed selling and administrative expenses were $12,590, prepare an income statement according to the variable costing concept. Round all final answers to whole dollars. 1:110 $109,200 (14,700) Fixed costs: $138,000 (94,500) $43,500 (25,700) $17,800arrow_forwardRequired: 1. Determine the unit product cost under: a. Absorption costing. b. Variable costing. 2. Prepare variable costing income statements for July and August. 3. Reconcile the variable costing and absorption costing net operating incomes.arrow_forward
arrow_back_ios
SEE MORE QUESTIONS
arrow_forward_ios
Recommended textbooks for you

 AccountingAccountingISBN:9781337272094Author:WARREN, Carl S., Reeve, James M., Duchac, Jonathan E.Publisher:Cengage Learning,
 Accounting Information SystemsAccountingISBN:9781337619202Author:Hall, James A.Publisher:Cengage Learning,
 Horngren's Cost Accounting: A Managerial Emphasis...AccountingISBN:9780134475585Author:Srikant M. Datar, Madhav V. RajanPublisher:PEARSON
 Intermediate AccountingAccountingISBN:9781259722660Author:J. David Spiceland, Mark W. Nelson, Wayne M ThomasPublisher:McGraw-Hill Education
 Financial and Managerial AccountingAccountingISBN:9781259726705Author:John J Wild, Ken W. Shaw, Barbara Chiappetta Fundamental Accounting PrinciplesPublisher:McGraw-Hill Education


Accounting
Accounting
ISBN:9781337272094
Author:WARREN, Carl S., Reeve, James M., Duchac, Jonathan E.
Publisher:Cengage Learning,

Accounting Information Systems
Accounting
ISBN:9781337619202
Author:Hall, James A.
Publisher:Cengage Learning,

Horngren's Cost Accounting: A Managerial Emphasis...
Accounting
ISBN:9780134475585
Author:Srikant M. Datar, Madhav V. Rajan
Publisher:PEARSON

Intermediate Accounting
Accounting
ISBN:9781259722660
Author:J. David Spiceland, Mark W. Nelson, Wayne M Thomas
Publisher:McGraw-Hill Education

Financial and Managerial Accounting
Accounting
ISBN:9781259726705
Author:John J Wild, Ken W. Shaw, Barbara Chiappetta Fundamental Accounting Principles
Publisher:McGraw-Hill Education