
Videos
Constructing Frequency Distributions. In Exercises 11–18, use the indicated data to construct the frequency distribution. (The data for Exercises 13-16 can be downloaded at TriolaStats.com.)
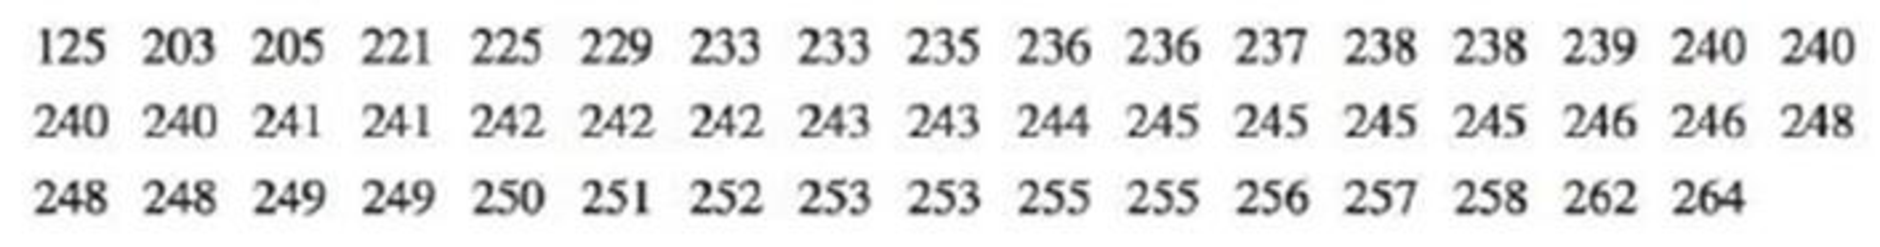
11. Old Faithful Listed below are sorted duration times (seconds) of eruptions of the Old Faithful geyser in Yellowstone National Park. Use these times to construct a frequency distribution. Use a class width of 25 seconds and begin with a lower class limit of 125 seconds.

Learn your wayIncludes step-by-step video

Chapter 2 Solutions
Elementary Statistics (13th Edition)
Additional Math Textbook Solutions
Statistics: The Art and Science of Learning from Data (4th Edition)
Elementary Statistics: Picturing the World (7th Edition)
Statistics for Business and Economics (13th Edition)
Essentials of Statistics, Books a la Carte Edition (5th Edition)
Introductory Statistics (2nd Edition)
Statistical Reasoning for Everyday Life (5th Edition)


- Constructing Frequency Distributions. In Exercises Il-18, use the indicated data to construct the frequency distribution. (The data for Exercises 13–16 can be downloaded at TriolaStats.com.) 11. Old Faithful Listed below are sorted duration times (seconds) of eruptions of the Old Faithful geyser in Yellowstone National Park. Use these times to construct a frequency distribu- tion. Use a class width of 25 seconds and begin with a lower class limit of 125 seconds. 125-203 205 221 225-229 233 233 235 236 236 237 238 238 239 240 240 240240 241241 242 242 242 243 243 244 245 245 245 245 246 246 248 248 248 249 249 250 251 252 253 253 255 255 256 2S7 258 262 264 12. Tornadoes Listed below are the F-scale intensities of recent tornadoes in the United States. Construct a frequency distribution. Do the intensities appear to have a normal distribution? 0 4 0 0 111 00 0 1 2 0 11 010 F Ill0 0111 10 010 0 1 0 0 1I1 30 0 0 0 0 3 000 2 0 13. Burger King Lunch Service Times Refer to Data Set 25 "Fast…arrow_forwardThe frequency distribution shown in the figure lists the annual salaries of the managers at Universal Manufacturing of Melonville. Construct a histogram to represent the data.arrow_forward3. Consider the frequency distribution. Draw a Frequency Bar Graph. Be sure to label both axes. Grade A D F Frequency 15 8 12 5 6arrow_forward
- Opo 8:33 PM Allowed po ba yung gantong question? Using the data below and the steps, or the square root method, make a frequency distribution table containing the following: 1. classes with the lower and upper limits 2. class boundaries 3. tally 4. frequencies 5. class marks 6. cumulative frequency Data: Below are the number of patients who visited the Out-patient Department of the Philippine General Hospital in each day of the month of December 2017. Construct a frequency distribution table. 37 26 76 65 83 78 59 85 84 43 77 66 62 58 60 63 72 86 78 75 45 73 63 78 54 70 53…arrow_forward1. Create the frequency table of the data.arrow_forwardComplete the frequency distribution shown below.arrow_forward
- Frequency distribution table.arrow_forward2. Construct FREQUENCY DISTRIBUTION TABLE. Show your solution for each step in constructing FDT. 135 42 49 110 50 112 42 44 120 48 52 52 55 50 56 58 60 140 62 62 70 84 73 76 78 80 85 138 65 68 86 92 94 94 88 90 49 100 108 109 50 112 114 115 48 130 40 85 139 60arrow_forwardThe table gives the frequency distribution for the final grades in a course. (Here A=4, B=3, C=2, D=1,F=0.) Determine the percentage of students who get a B or higher. Grade 0 1 2 3 4 Number of Occurrences 3 6 4 3 How could the answer be found? OA. Add the number of occurrences for each grade that is a B or higher. Then, divide by the number of grades. OB. Find the probability of each grade. Then, add them together to find the percent OC. Find the probability of each grade that is a B or higher. Then, find the average of those probabilities. OD. Find the probability of each grade. Then, add the probabilities for the grades that are a B or higher together to find the percent. The percentage of students who get a B or higher isarrow_forward
- During one shift, the express lane clerk recorded how many times customers violated the "10 items or less" rule for his lane. In particular, he recorded how many items over the limit each violator placed on the conveyor belt. This data is summarized in the histogram below. NOTE: The last class actually represents "7 or more items," not just 7 items. Frequency 144 12- 10+ 8- 0.5 1.5 2.5 3.5 4.5 5.5 6.5 7.5 #items over 10 Q What is the frequency of times the limit was exceeded by at least 2 items? Answer: timesarrow_forwardDuring one shift, the express lane clerk recorded how many times customers violated the "10 items or less" rule for his lane. In particular, he recorded how many items over the limit each violator placed on the conveyor belt. This data is summarized in the histogram below. NOTE: The last class actually represents "7 or more items," not just 7 items. Frequency 12+ 10- 8 6 4 2 0.5 1.5 2.5 3.5 4.5 5.5 6.5 7.5 #items over 10 Q What is the most frequent number of over-the-limit items for this data set? ans = What is the frequency of the most frequent number of over-the-limit items? ans =arrow_forwardConstruct a frequency distribution of the data. Potholes Frequency 1 2 4 5 6 Construct a frequency histogram of the data. 3.arrow_forward
 Glencoe Algebra 1, Student Edition, 9780079039897...AlgebraISBN:9780079039897Author:CarterPublisher:McGraw Hill