Concept explainers
Videos
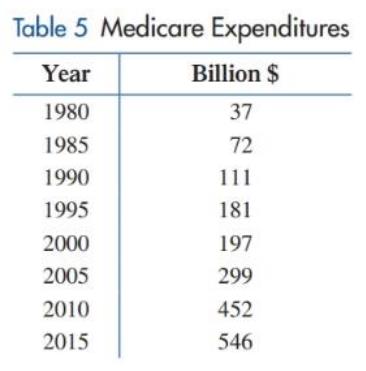
Medicare. The annual expenditures for Medicare (in billions of dollars) by the U.S. government for selected years since
(A) Find an exponential regression model
(B) When will the annual expenditures exceed two trillion dollars?
Want to see the full answer?
Check out a sample textbook solution
Chapter 2 Solutions
Finite Mathematics for Business, Economics, Life Sciences, and Social Sciences (13th Edition)
Additional Math Textbook Solutions
Thinking Mathematically (7th Edition)
Excursions in Modern Mathematics (9th Edition)
Using and Understanding Mathematics: A Quantitative Reasoning Approach (6th Edition)
Mathematics All Around (6th Edition)
Mathematical Ideas (13th Edition) - Standalone book
Thinking Mathematically (6th Edition)


- What is regression analysis? Describe the process of performing regression analysis on a graphing utility.arrow_forwardThe US. import of wine (in hectoliters) for several years is given in Table 5. Determine whether the trend appearslinear. Ifso, and assuming the trend continues, in what year will imports exceed 12,000 hectoliters?arrow_forwardDoes Table 1 represent a linear function? If so, finda linear equation that models the data.arrow_forward
- Life Expectancy The following table shows the average life expectancy, in years, of a child born in the given year42 Life expectancy 2005 77.6 2007 78.1 2009 78.5 2011 78.7 2013 78.8 a. Find the equation of the regression line, and explain the meaning of its slope. b. Plot the data points and the regression line. c. Explain in practical terms the meaning of the slope of the regression line. d. Based on the trend of the regression line, what do you predict as the life expectancy of a child born in 2019? e. Based on the trend of the regression line, what do you predict as the life expectancy of a child born in 1580?2300arrow_forwardThe U.S. Census tracks the percentage of persons 25 years or older who are college graduates. That data forseveral years is given in Table 4[14]. Determine whether the trend appears linear. If so, and assuming the trendcontinues. in what year will the percentage exceed 35%?arrow_forwardCable TV The following table shows the number C. in millions, of basic subscribers to cable TV in the indicated year These data are from the Statistical Abstract of the United States. Year 1975 1980 1985 1990 1995 2000 C 9.8 17.5 35.4 50.5 60.6 60.6 a. Use regression to find a logistic model for these data. b. By what annual percentage would you expect the number of cable subscribers to grow in the absence of limiting factors? c. The estimated number of subscribers in 2005 was 65.3million. What light does this shed on the model you found in part a?arrow_forward
- Demand for Candy Bars In this problem you will determine a linear demand equation that describes the demand for candy bars in your class. Survey your classmates to determine what price they would be willing to pay for a candy bar. Your survey form might look like the sample to the left. a Make a table of the number of respondents who answered yes at each price level. b Make a scatter plot of your data. c Find and graph the regression line y=mp+b, which gives the number of respondents y who would buy a candy bar if the price were p cents. This is the demand equation. Why is the slope m negative? d What is the p-intercept of the demand equation? What does this intercept tell you about pricing candy bars? Would you buy a candy bar from the vending machine in the hallway if the price is as indicated. Price Yes or No 50 75 1.00 1.25 1.50 1.75 2.00arrow_forwardThe average top ticket price for Broadway musicals has increased dramatically between 1975 and 2003. Year 1975 1985 1998 2000 2003 Average Ticket Price 13.56 44.93 72.96 119.14 130.07 Question a. Using the data in the table, find the linear regression equation that best fits the data. (Let x = 0 represent the number of years since 1970.) b. Predict the average top ticket price for Broadway musicals in the year 2010 if the price continues to increase at the same rate. (Let x represent the number of years since 1970.) c. Find the rate at which the price is rising.arrow_forwardQuestion is in the photo attached.arrow_forward
- The number of Master’s degrees granted at a particular university is given for selected years in the table below. Year 2005 2010 2015 2020 Number of Master’s Degrees 58 69 76 83 Use the linear regression equation for this data to predict the number of Master’s degrees that this university will grant in the year 2021. Blank 1. Calculate the answer by read surrounding text. Round to the nearest whole number of Master's degrees.arrow_forwardThe reason why estimators have a sampling distribution is that: oooo Economics is not a precise science In real life you typically get to sample many times Individuals respond different to incentives The values of the explanatory variable and the error term differ across samples.arrow_forwardThe following table shows the amount of a chemical substance over time. Time (hours) Amount (mg) 25 37 27 28 32 27 34 26 44 24 (a) Find a linear regression equation based on the table. Round each number to two decimal places and use x for the variable. (b) Using your equation from (b), estimate the amount of the substance in 24 hours. milligramsarrow_forward
 Glencoe Algebra 1, Student Edition, 9780079039897...AlgebraISBN:9780079039897Author:CarterPublisher:McGraw Hill
 Functions and Change: A Modeling Approach to Coll...AlgebraISBN:9781337111348Author:Bruce Crauder, Benny Evans, Alan NoellPublisher:Cengage Learning
 Algebra and Trigonometry (MindTap Course List)AlgebraISBN:9781305071742Author:James Stewart, Lothar Redlin, Saleem WatsonPublisher:Cengage Learning
 Algebra & Trigonometry with Analytic GeometryAlgebraISBN:9781133382119Author:SwokowskiPublisher:Cengage
 Big Ideas Math A Bridge To Success Algebra 1: Stu...AlgebraISBN:9781680331141Author:HOUGHTON MIFFLIN HARCOURTPublisher:Houghton Mifflin Harcourt