
MATLAB: An Introduction with Applications
6th Edition
ISBN: 9781119256830
Author: Amos Gilat
Publisher: John Wiley & Sons Inc
expand_more
expand_more
format_list_bulleted
Related questions
Question
thumb_up100%
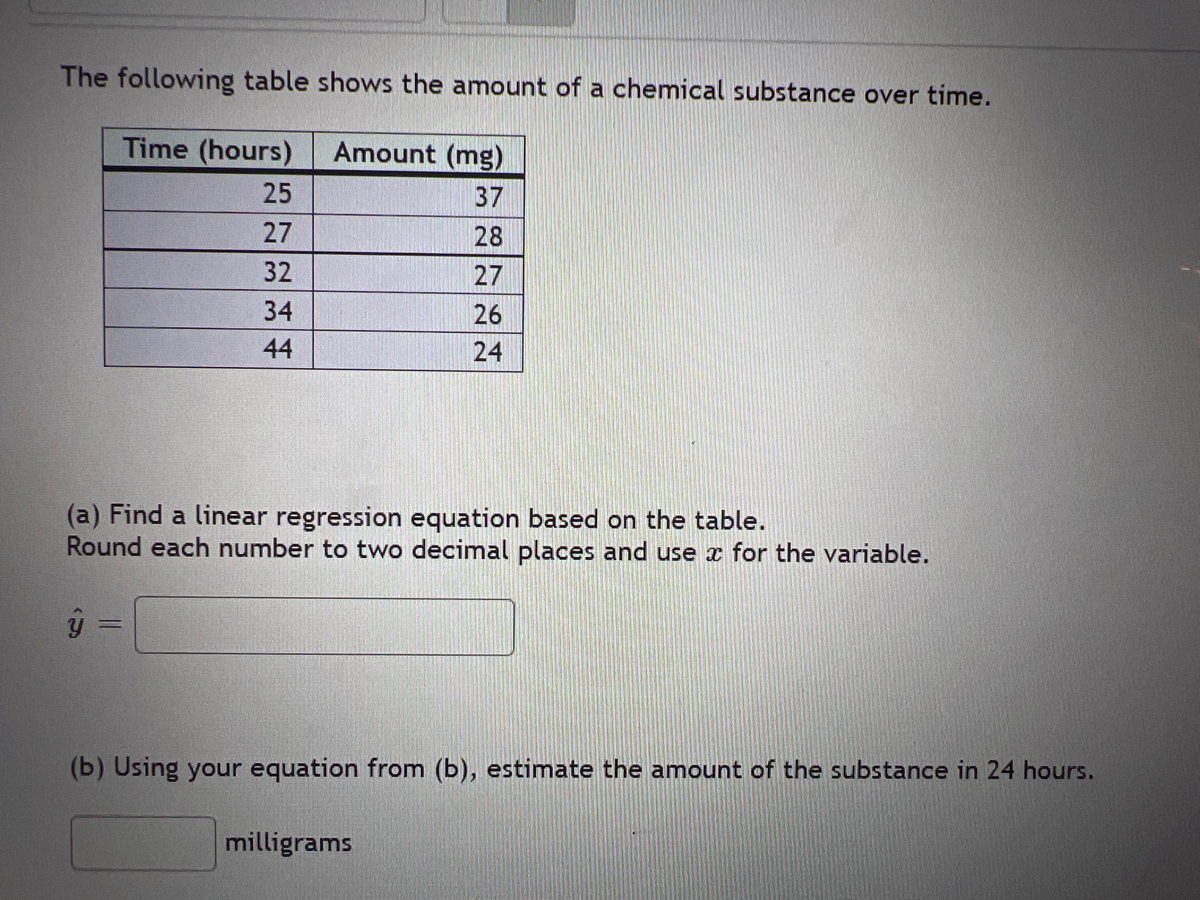

Transcribed Image Text:The following table shows the amount of a chemical substance over time.
Time (hours)
Amount (mg)
25
37
27
28
32
27
34
26
44
24
(a) Find a linear regression equation based on the table.
Round each number to two decimal places and use x for the variable.
(b) Using your equation from (b), estimate the amount of the substance in 24 hours.
milligrams
Expert Solution
This question has been solved!
Explore an expertly crafted, step-by-step solution for a thorough understanding of key concepts.

Step by stepSolved in 2 steps

Knowledge Booster

Similar questions
- It is thought that basketball teams that make too many fouls in a game tend to lose the game even ir they otherwise play well. Let x be the number of fouls more than (i.e., over and above) the opposing team. Let y be the percentage of times the team with the larger number of fouls wins the game. X 0 2 5 6 y 50 43 33 26 A USE SALT Complete parts (a) through (e), given Ex - 13, Ey - 152, Er - 65, Ey? - 6114, Exy - 407, and r-0.9921. (a) Draw a scatter diagram displaying the data 50 50 45 45 40 40 35 30 30 0 25 25 30 35 40 45 50 4 30 35 40 43 50 4 x(fouls) x (fouls) xifouls) x (fouls) (b) Verify the given sums Ex, Zy, Ex, Ey, Exy, and the value of the sample correlation coefficient r. (Round your value for r to four decimal places.) Ex- Exy= (c) Find x, and y. Then find the equation of the least-squares line -a+ bx. (Round your answers to four decimal places.) (d) Graph the least-squares line. Be sure to plot the point (x, y) as a point on the line. 50 50 5 5 45 45 40 40 35 30 30 25 25k…arrow_forwardHelp!!arrow_forwardThe velocities (in feet/min) of currents in the Columbia River in Washington State were measured every minute for just over an hour at a depth 95% the depth of the river. The velocities are listed in the table below. 210 208 197 194 210 221 199 210 210 205 201 194 214 163 201 203 208 190 210 217 217 201 184 188 172 184 214 199 205 210 210 201 221 205 192 212 208 226 181 197 212 201 212 194 203 181 202 188 218 201 197 208 197 199 201 199 199 190 205 197 201 236 194 214 210 194 Use this information to answer the following problems.arrow_forward
- NarStor, a computer disk drive manufacturer, claims that the average time to failure for its hard drives is 14,400 hours. You work for a consumer group that has decided to examine this claim. Technicians ran 16 drives continuously for three years. Recently the last drive failed. The time to failure (in hours) are given below. Time Until Failure(Hours) 330 620 1870 2410 4620 6396 7822 8102 8309 12,882 14,419 16,092 18,384 20,916 23,812 25,814 Conduct a hypothesis test to determine whether there is any evidence that the average time to failure is less than the manufacturer’s claim. Use alpha = 0.01 What assumption did you make in performing the test? What is the p-value?arrow_forwardA tank is leaking at an increasing rate as indicated by the data below. Use the table to answer the following questions. Time (hr) Leakage (gal/hr) 1 30 2 3 7 8 720 4 65 150 240 290 410 550 650 An upper limit estimate for the amount of material leaked after 4 hours is (Simplify your answer.) gal. A lower limit estimate for the amount of material leaked after 4 hours is gal. (Simplify your answer.) An upper limit estimate for the amount of material leaked after 8 hours is (Simplify your answer.) gal. A lower limit estimate for the amount of material leaked after 8 hours is gal. (Simplify your answer.) If the leakage occurs at a constant rate of 720 gal/hr after 8 hours and the tank initially held 20,000 gallons of material, an estimate for the least amount of time for the tank to empty is hr. (Round to the nearest tenth as needed.) If the leakage occurs at a constant rate of 720 gal/hr after 8 hours and the tank initially held 20,000 gallons of material, an estimate for the most amount…arrow_forwardCan balloons hold more air or more water before bursting? A student purchased a large bag of 12-inch balloons. He randomly selected 10 balloons from the bag and then randomly assigned half of them to be filled with air until bursting and the other half to be filled with water until bursting. He used devices to measure the amount of air and water was dispensed until the balloons burst. Here are the dataarrow_forward
- Calculate the value A. 0.3 B. 0.4 C. 0.5 D. 0.6 E. 0.7arrow_forwardTimber yield is approximately equal to the volume of a tree, however, this value is difficult to measure without first cutting the tree down. Instead, other variables, such as height and diameter, may be used to predict a tree's volume and yield. Below is data on diameter (inches), height (feet), and volume (cubic feet) diameter height volume 18 80 51.5 8.3 70 10.3 11.2 75 19.9 13.3 86 27.4 12.9 85 33.8 11.7 69 21.3 20.6 87 77 11.4 76 21.4 17.9 80 58.3 13.7 71 25.7 16 72 38.3 10.7 81 18.8 10.8 83 19.7 16.3 77 42.6 12 75 19.1 13.8 64 24.9 10.5 72 16.4 17.3 81 55.4 11 75 18.2 11.4 76 21 8.8 63 10.2 14.2 80 31.7 Develop a regression model to use diameter and height to predict volume. Report the adjusted R-squared. Blank 1. Fill in the blank, read surrounding text.arrow_forward210 people are asked how many siblings they have? # of Siblings Frequency Relative Frequency Cumulative Frequency 0 0.1714 40 1 2 39 3 52 4 43 a. Complete the table (Use 4 decimal places when applicable) b. What percent of the people have exactly two siblings? 36 0.1857 0.2476 0.2048 115 167 210arrow_forward
arrow_back_ios
arrow_forward_ios
Recommended textbooks for you
- MATLAB: An Introduction with ApplicationsStatisticsISBN:9781119256830Author:Amos GilatPublisher:John Wiley & Sons Inc
 Probability and Statistics for Engineering and th...StatisticsISBN:9781305251809Author:Jay L. DevorePublisher:Cengage Learning
 Statistics for The Behavioral Sciences (MindTap C...StatisticsISBN:9781305504912Author:Frederick J Gravetter, Larry B. WallnauPublisher:Cengage Learning
  Elementary Statistics: Picturing the World (7th E...StatisticsISBN:9780134683416Author:Ron Larson, Betsy FarberPublisher:PEARSON
 The Basic Practice of StatisticsStatisticsISBN:9781319042578Author:David S. Moore, William I. Notz, Michael A. FlignerPublisher:W. H. Freeman
 Introduction to the Practice of StatisticsStatisticsISBN:9781319013387Author:David S. Moore, George P. McCabe, Bruce A. CraigPublisher:W. H. Freeman
MATLAB: An Introduction with Applications
Statistics
ISBN:9781119256830
Author:Amos Gilat
Publisher:John Wiley & Sons Inc
Probability and Statistics for Engineering and th...
Statistics
ISBN:9781305251809
Author:Jay L. Devore
Publisher:Cengage Learning
Statistics for The Behavioral Sciences (MindTap C...
Statistics
ISBN:9781305504912
Author:Frederick J Gravetter, Larry B. Wallnau
Publisher:Cengage Learning
Elementary Statistics: Picturing the World (7th E...
Statistics
ISBN:9780134683416
Author:Ron Larson, Betsy Farber
Publisher:PEARSON
The Basic Practice of Statistics
Statistics
ISBN:9781319042578
Author:David S. Moore, William I. Notz, Michael A. Fligner
Publisher:W. H. Freeman
Introduction to the Practice of Statistics
Statistics
ISBN:9781319013387
Author:David S. Moore, George P. McCabe, Bruce A. Craig
Publisher:W. H. Freeman