
Intermediate Financial Management
14th Edition
ISBN: 9780357516782
Author: Brigham, Eugene F., Daves, Phillip R.
Publisher: Cengage Learning
expand_more
expand_more
format_list_bulleted
Concept explainers
Videos
Textbook Question
Chapter 2, Problem 6P
The market and Stock J have the following probability distributions:
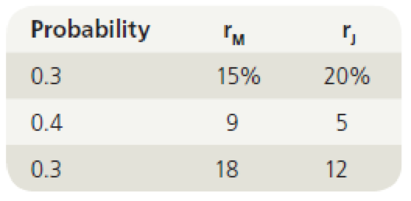
- a. Calculate the expected
rates of return for the market and Stock J. - b. Calculate the standard deviations for the market and Stock J.
Expert Solution & Answer
Want to see the full answer?
Check out a sample textbook solution
Students have asked these similar questions
Beta is which of the following:
A) standard deviation.
B) total risk.
C) Beta is the relationship which is between an investment's return, and the market return.
D) unsystematic risk.
Suppose you have the following expectations about the market condition and the returns on Stocks X and Y.
a) What are the expected returns for Stocks X and Y, E(rX) and E(rY)?
b) What are the standard deviations of the returns for Stocks X and Y, σX and σY?
Which of the following measures the total risk of a portfolio?
A. Standard Deviation
B. Correlation Coefficient
C. Beta
D. Alpha
Chapter 2 Solutions
Intermediate Financial Management
Ch. 2 - Prob. 2QCh. 2 - Security A has an expected return of 7%, a...Ch. 2 - Prob. 4QCh. 2 - Prob. 5QCh. 2 - Your investment club has only two stocks in its...Ch. 2 - AA Corporations stock has a beta of 0.8. The...Ch. 2 - Suppose that the risk-free rate is 5% and that the...Ch. 2 - Prob. 5PCh. 2 - The market and Stock J have the following...Ch. 2 - Prob. 7P
Ch. 2 - Prob. 8PCh. 2 - Prob. 9PCh. 2 - Prob. 10PCh. 2 - Prob. 11PCh. 2 - Stock R has a beta of 1.5, Stock S has a beta of...Ch. 2 - Prob. 1MCCh. 2 - Prob. 2MCCh. 2 - Prob. 3MCCh. 2 - What is the stand-alone risk? Use the scenario...Ch. 2 - Prob. 5MCCh. 2 - Prob. 6MCCh. 2 - Prob. 7MCCh. 2 - Prob. 8MCCh. 2 - Prob. 9MCCh. 2 - Prob. 10MCCh. 2 - Prob. 11MCCh. 2 - Prob. 12MCCh. 2 - Prob. 13MCCh. 2 - Prob. 14MCCh. 2 - Prob. 15MCCh. 2 - Prob. 16MCCh. 2 - Prob. 17MCCh. 2 - Prob. 18MC
Knowledge Booster


Learn more about
Need a deep-dive on the concept behind this application? Look no further. Learn more about this topic, finance and related others by exploring similar questions and additional content below.Similar questions
- (c) Consider information given in the table below and answers the question asked thereafter: i. Calculate expected return on each stock? On the basis of this measure, which stock you will choose?ii. Calculate standard deviation of the returns on each stock? On the basis of this measure, which stock you will choose?iii. Calculate coefficient of variance of the returns on each stock? On the basis of this measure, which stock you will choose?iv. Calculate covariance and coefficient of correlation between the returns of the stocks A and B.v. Now suppose you have $100,000 to invest and you want to a hold a portfolio comprising of $35,000 invested in stock A and remaining amount in stock B. Calculate risk and return of your portfolio. (d) Firm A reports a Profit Margin of 6.5% and a Total Asset Turnover Ratio of 3.25. Their total asset level is $8,500,000. Assume there are 700,000 shares outstanding and the PE ratio is 11. Also, assume the Return on Equity is 16%. Based on this, calculate…arrow_forwardWhen working with the CAPM, which of the following factors can be determined with the most precision? a. The beta coefficient of "the market," which is the same as the beta of an average stock. b. The beta coefficient, bi, of a relatively safe stock. c. The market risk premium (RPM). d. The most appropriate risk-free rate, rRF. e. The expected rate of return on the market, rM.arrow_forwardHow are the following used on a stand-alone and a portfolio basis? 1. Standard Deviation 2. Variance 3. Covariancearrow_forward
- A plot/graph of the positive relation between systematic risk and expected return is called: O security market line standard deviation and width of the normal distribution O covariance graph O capital asset pricing modelarrow_forwardThe expected rate of return of an investment ________. a. equals one of the possible rates of return for that investment b. equals the required rate of return for the investment c. is the mean value of the probability distribution of possible returns d. is the median value of the probability distribution of possible returns e. is the mode value of the probability distribution of possible returnsarrow_forwardA price-weighted index such as the DJIA is a geometric mean of current stock prices. a. True b. Falsearrow_forward
- The Black-Scholes OPM is dependent on which five parameters? Select one: a. Stock price, exercise price, risk free rate, beta, and time to maturity b. Stock price, risk free rate, beta, time to maturity, and variance c. Stock price, exercise price, risk free rate, standard deviation and time to maturity d. Stock price, risk free rate, probability, standard deviation and exercise pricearrow_forwardThe appropriate measure of risk used in Sharpe's measure of portfolio evaluation is a. Range b. Variance c. Beta d. Standard deviationarrow_forwardExpected return and standard deviation a. What is the expected return of asset J?arrow_forward
- Consider two assets. Suppose that the return on asset 1 has expected value 0.05 and standard deviation 0.1 and suppose that the return on asset 2 has expected value 0.02 and standard deviation 0.05. Suppose that the asset returns have correlation 0.4.Consider a portfolio placing weight w on asset 1 and weight 1-w on asset 2; let Rp denote the return on the portfolio. Find the mean and variance of Rp as a function of w.arrow_forwardPlease find the following: The investment's expected return as a percentage: The investment's standard deviation:arrow_forwardThe probability distribution of returns for the two stocks X and Y are as follows: Probability 0.1 0.3 0.05 0.25 0.15 0.15 For each of the two stocks, calculate: a. The expected return. b. Variance of returns c. Volatility of returns. Stock X 0.05 -0.1 0.08 -0.08 0.20 0.12 Return Stock Y 0.13 0,04 -0.12 0.21 0.1 -0.05arrow_forward
arrow_back_ios
SEE MORE QUESTIONS
arrow_forward_ios
Recommended textbooks for you
 Intermediate Financial Management (MindTap Course...FinanceISBN:9781337395083Author:Eugene F. Brigham, Phillip R. DavesPublisher:Cengage Learning
 EBK CONTEMPORARY FINANCIAL MANAGEMENTFinanceISBN:9781337514835Author:MOYERPublisher:CENGAGE LEARNING - CONSIGNMENT
Intermediate Financial Management (MindTap Course...
Finance
ISBN:9781337395083
Author:Eugene F. Brigham, Phillip R. Daves
Publisher:Cengage Learning
EBK CONTEMPORARY FINANCIAL MANAGEMENT
Finance
ISBN:9781337514835
Author:MOYER
Publisher:CENGAGE LEARNING - CONSIGNMENT
Portfolio return, variance, standard deviation; Author: MyFinanceTeacher;https://www.youtube.com/watch?v=RWT0kx36vZE;License: Standard YouTube License, CC-BY