
Essentials of Business Analytics (MindTap Course List)
2nd Edition
ISBN: 9781305627734
Author: Jeffrey D. Camm, James J. Cochran, Michael J. Fry, Jeffrey W. Ohlmann, David R. Anderson
Publisher: Cengage Learning
expand_more
expand_more
format_list_bulleted
Concept explainers
Videos
Textbook Question
Chapter 2, Problem 2P
The following table contains a partial list of countries, the continents on which they are located, and their respective gross domestic products (GDP) in U.S. dollars. A list of 125 countries and their GDPs is contained in the file GDPlist.
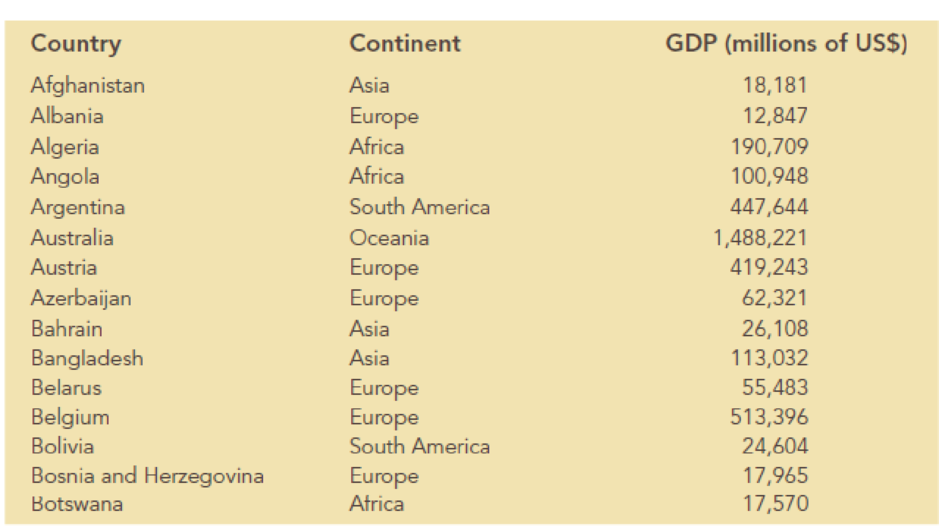
- a. Sort the countries in GDPlist from largest to smallest GDP. What are the top 10 countries according to GDP?
- b. Filter the countries to display only the countries located in Africa. What are the top 5 countries located in Africa according to GDP?
- c. What are the top 5 countries by GDP that are located in Europe?
Expert Solution & Answer
Want to see the full answer?
Check out a sample textbook solution
Students have asked these similar questions
One hundred college seniors attending a career fair at a university were categorized according
The following table shows the number of active military personnel in 2009, by reglon (including the District of Columbia). 229,834 Mountain 89,816 West South Central 177,336 Pacific West North Central 64,564 East North Central 26,384 East South Central 68,440 South Atlantic 376.034 Middle Atlantic 4 41,441 New England 8,579 Source: U.S. Census Bureau, Statistical Abstract of the United States: 2012, Table 508 (data) and U.S. Census Bureau, Census Regions and Divisions of the United States (regions) a. Calculate the mean and standard deviation for the population. b. Now take 10 samples of size 3 from the population. Use either simple randonm sampling or systematic sampling with the help of the table of random numbers in Appendix A. Calculate the mean for each sample. c. Once you have calculated the mean for each sample, calculate the mean of means (ie., add up your 10 sample means and divide by 10). How does this mean compare with the mean for all states? How does the value of the…
The following table shows the number of fifth and sixth grade teachers in a school district and the number of students in each of those grades. The number of teachers for each of the grade levels was determined by using the Huntington-hill apportionment method. The district has decided to hire a new teacher for either the fifth or sixth grade.
Chapter 2 Solutions
Essentials of Business Analytics (MindTap Course List)
Ch. 2 - A Wall Street Journal subscriber survey asked 46...Ch. 2 - The following table contains a partial list of...Ch. 2 - Ohio Logistics manages the logistical activities...Ch. 2 - A partial relative frequency distribution is...Ch. 2 - In a recent report, the top five most-visited...Ch. 2 - In a study of how chief executive officers (CEOs)...Ch. 2 - Consumer complaints are frequently reported to the...Ch. 2 - Reports have found that many U.S. adults would...Ch. 2 - Consider the following data: a. Develop a...Ch. 2 - Consider the following frequency distribution....
Ch. 2 - The owner of an automobile repair shop studied the...Ch. 2 - Approximately 1.65 million high school students...Ch. 2 - Consider a sample with data values of 10, 20, 12,...Ch. 2 - Consider a sample with data values of 27, 25, 20,...Ch. 2 - Consider a sample with data values of 53, 55, 70,...Ch. 2 - If an asset declines in value from 5,000 to 3,500...Ch. 2 - Suppose that you initially invested 10,000 in the...Ch. 2 - The average time that Americans commute to work is...Ch. 2 - Suppose that the average waiting time for a...Ch. 2 - According to the National Education Association...Ch. 2 - Return to the waiting times given for the...Ch. 2 - The results of a national survey showed that on...Ch. 2 - Suppose that the national average for the math...Ch. 2 - Five observations taken for two variables follow....Ch. 2 - The scatter chart in the following figure was...Ch. 2 - The economic downturn in 20082009 resulted in the...Ch. 2 - Heavenly Chocolates manufactures and sells quality...
Knowledge Booster


Learn more about
Need a deep-dive on the concept behind this application? Look no further. Learn more about this topic, statistics and related others by exploring similar questions and additional content below.Similar questions
- How many three-member committees can be formed from a group of seven people?arrow_forwardLabel the columns of the table of the World Bank, four income groups 2017? Low income 31 Lower middle income 56 Upper middle income 54 High income 53arrow_forwardIn the City of Manila, the total population is 1,750,873 and there are six districts within the area. Compute for its average, and the number of people in the clustered group(desire = 90).arrow_forward
- The following table shows the number of active military personnel in 2009, by region (including the District of Columbia). Pacific 229,634 Mountain 89,816 West South Central 177,336 West North Central 64,564 East North Central 26,384 East South Central 68,440 South Atlantic 376,034 Middle Atlantic 41,441 New England 8,579 Source: U.S. Census Bureau, Statistical Abstract of the United States: 2012, Table 508 (data) and U.S. Census Bureau, Census Regions and Divisions of the United States (regions). Calculate the mean and standard deviation for the population. Now take 10 samples of size 3 from the population. Use either simple random sampling or systematic sampling with the help of the table of random numbers in Appendix A. Calculate the mean for each sample. Once you have calculated the mean for each sample, calculate the mean of means (i.e., add up your 10 sample means and divide by 10). How does this mean compare with the mean for all…arrow_forwardThe five number summary for the populations of the 50 US states, in millions of people, is (0.506, 1.660, 4.170, 6.676, 35.842). The table shows all 50 populations listed in order. 0.506 0.621 0.636 0.658 0.771 0.830 0.927 1.080 1.262 1.299 1.315 1.395 1.748 1.813 1.903 2.333 2.421 2.734 2.750 2.901 2.953 3.499 3.524 3.591 4.142 4.198 4.507 4.525 4.602 5.097 5.504 5.561 5.740 5.760 5.893 6.207 6.227 6.407 7.481 8.540 8.685 8.918 10.104 11.450 12.394 12.712 17.385 19.281 22.472 35.842 How many people are in the smallest state? Calculate the IQR. Any state’s population that is more than Q3 + 1.5∗IQR is considered an outlier. Similarly, any population less than Q1 – 1.5∗IQR is an outlier. Determine whether there are any outliers, and, if so, identify themarrow_forwardMany countries, especially those in Europe, have significant gold holdings. But many of these countries also have massive debts. The following data show the total value of gold holdings in billions of U.S. dollars and the debt as a percentage of the gross domestic product for nine countries (WordPress and Trading Economics websites, February 24, 2012). Click on the datafile logo to reference the data. Country Gold Value Debt China 63 17.7 France 146 81.7 Germany 203 83.2 Indonesia 33 69.2 Italy 147 119 Netherlands 36 63.7 Russia 50 9.9 Switzerland 62 55 U.S. 487 93.2 Using the entire data set, develop the estimated regression equation that can be used to predict the debt of a country given the total value of its gold holdings. y^ = (to 4 decimals) (to 4 decimals) Gold Value Suppose that after looking at the scatter diagram in part (a) that you were able to visually identify what appears to be an…arrow_forward
- Calculate missing information in the given table:arrow_forwardClassify the following.arrow_forwardIf all the HRDs who completed the survey from the energy industry had their head office in Asia, how many more people is this than we would expect, from what we know about the geographical location of Head offices more generally? 4, 17, 21, 43, or 47?arrow_forward
- Students at a private liberal arts college are classified as being freshmen, sophomores, juniors, or seniors, and also according to whether they are male or female. Find the total number of possible classifications for the students of that college.arrow_forwardTop 50 Metro Areas by Population: Personal Income, Population, Per Capita Personal Income Rank Metro GeoName Total Metro Personal Income 2020 (000s) Per Capita Personal Income 2020 Population 2020 (millions) # of NFL, NBA, MLB, NHL teams 1 New York-Newark-Jersey City, NY-NJ-PA 1574364671 82322 19.124359 9 2 Los Angeles-Long Beach-Anaheim, CA 915132543 69805 13.109903 6 3 Chicago-Naperville-Elgin, IL-IN-WI 636555184 67671 9.406638 5 4 Dallas-Fort Worth-Arlington, TX 473604117 61554 7.694138 4 5 Houston-The Woodlands-Sugar Land, TX 428500645 59893 7.154478 3 6 Washington-Arlington-Alexandria, DC-VA-MD-WV 485550913 76771 6.324629 4 7 Miami-Fort Lauderdale-Pompano Beach, FL 396247347 64190 6.173008 4 8 Philadelphia-Camden-Wilmington, PA-NJ-DE-MD 425748748 69705 6.107906 4 9 Atlanta-Sandy Springs-Alpharetta, GA 357795984 58773 6.087762 3 10 Phoenix-Mesa-Chandler, AZ 262362901 51851 5.059909 4 11…arrow_forwardHow many different committees of three persons each can be chosen from a group of twelve people?arrow_forward
arrow_back_ios
SEE MORE QUESTIONS
arrow_forward_ios
Recommended textbooks for you
 MATLAB: An Introduction with ApplicationsStatisticsISBN:9781119256830Author:Amos GilatPublisher:John Wiley & Sons Inc
 Probability and Statistics for Engineering and th...StatisticsISBN:9781305251809Author:Jay L. DevorePublisher:Cengage Learning
 Statistics for The Behavioral Sciences (MindTap C...StatisticsISBN:9781305504912Author:Frederick J Gravetter, Larry B. WallnauPublisher:Cengage Learning
 Elementary Statistics: Picturing the World (7th E...StatisticsISBN:9780134683416Author:Ron Larson, Betsy FarberPublisher:PEARSON
 The Basic Practice of StatisticsStatisticsISBN:9781319042578Author:David S. Moore, William I. Notz, Michael A. FlignerPublisher:W. H. Freeman
 Introduction to the Practice of StatisticsStatisticsISBN:9781319013387Author:David S. Moore, George P. McCabe, Bruce A. CraigPublisher:W. H. Freeman
MATLAB: An Introduction with Applications
Statistics
ISBN:9781119256830
Author:Amos Gilat
Publisher:John Wiley & Sons Inc
Probability and Statistics for Engineering and th...
Statistics
ISBN:9781305251809
Author:Jay L. Devore
Publisher:Cengage Learning
Statistics for The Behavioral Sciences (MindTap C...
Statistics
ISBN:9781305504912
Author:Frederick J Gravetter, Larry B. Wallnau
Publisher:Cengage Learning
Elementary Statistics: Picturing the World (7th E...
Statistics
ISBN:9780134683416
Author:Ron Larson, Betsy Farber
Publisher:PEARSON
The Basic Practice of Statistics
Statistics
ISBN:9781319042578
Author:David S. Moore, William I. Notz, Michael A. Fligner
Publisher:W. H. Freeman
Introduction to the Practice of Statistics
Statistics
ISBN:9781319013387
Author:David S. Moore, George P. McCabe, Bruce A. Craig
Publisher:W. H. Freeman
Find number of persons in a part with 66 handshakes Combinations; Author: Anil Kumar;https://www.youtube.com/watch?v=33TgLi-wp3E;License: Standard YouTube License, CC-BY
Discrete Math 6.3.1 Permutations and Combinations; Author: Kimberly Brehm;https://www.youtube.com/watch?v=J1m9sB5XZQc;License: Standard YouTube License, CC-BY
How to use permutations and combinations; Author: Mario's Math Tutoring;https://www.youtube.com/watch?v=NEGxh_D7yKU;License: Standard YouTube License, CC-BY
Permutations and Combinations | Counting | Don't Memorise; Author: Don't Memorise;https://www.youtube.com/watch?v=0NAASclUm4k;License: Standard Youtube License
Permutations and Combinations Tutorial; Author: The Organic Chemistry Tutor;https://www.youtube.com/watch?v=XJnIdRXUi7A;License: Standard YouTube License, CC-BY