
(a)
Identify the role of scarcity on
(a)
Explanation of Solution
Figure 1 illustrates the PPF of Company B.
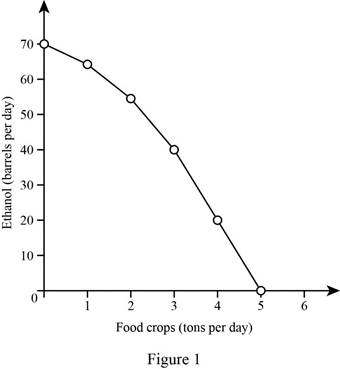
In Figure 1, the x-axis shows food crops and the y-axis shows ethanol. The PPF shows the production combinations of ethanol and food crops. The production combinations of these commodities lie beyond the PPF and are not attainable with the given resources; this indicates the concept of scarcity. The movement along the PPF also indicates scarcity because when one good produces more, other goods are reduced.
Scarcity: Scarcity refers to the limited availability of resources than the required level.
Production possibility frontier: Production possibility frontier shows the boundary between the combination of two goods and services that can produced at the given level of resources.
(b)
Identify the concept of production efficiency.
(b)
Explanation of Solution
A production possibility frontier shows the combination of two commodities that can be produced at the given level of resources. Therefore, the combinations of commodities that lie along the PPF indicate efficient production levels. In this case, if Company B produces 40 barrels of ethanol per day, then the production of food per day needed to achieve the production efficiency will be 3 tons.
Efficient production: Efficient production shows the combinations of two commodities that lie along the PPF.
(c)
Identify the concept of tradeoff in a PPF.
(c)
Explanation of Solution
A movement along the PPF curve explains that producing more of one good leads to producing less of another good. Therefore, there is a tradeoff that exists between the commodities; it is also noted that this type of tradeoff exists only at an efficient production level. In this case, Company B has limited resources and technology. Therefore, an increase in the production of one good decreases the production of the other good. As a result, Company B will face a tradeoff on its PPF.
Production possibility frontier: Production possibility frontier shows the boundary between the combination of two goods and services that can be produced at the given level of resources.
Want to see more full solutions like this?
Chapter 2 Solutions
Macroeconomics (12th Edition) (Pearson Series in Economics)

- Don't give AI generated solution otherwise I will give you downwardarrow_forwardConsider the following Bertrand Duopoly game between Firm A and Firm B. Firm B Bertrand Duopoly Low Price High Price Low Price 0,0 5,-1 Firm A High Price -1,5 3,3 a. Is there a dominant strategy equilibrium for a one-shot, simultaneous-move game? If so, what is it? If not, explain why. (2 points) b. Identify any and all Nash equilibria for a one-shot, simultaneous-move game. (1 point) c. What is Firm A's secure strategy for a one-shot, simultaneous-move game? What is Firm B's secure strategy for a one-shot, simultaneous-move game? (2 points) d. Assume that Firm A and Firm B agree to collude and both charge high prices as long as neither of them cheats by charging low prices. If one of the firms cheats, trigger strategies take hold whereby the "victim" punishes the "cheater" by charging low prices forever after. If this game is infinitely repeated, calculate the interest rate (i) necessary to sustain collusion. (3 points) e. Assume that Firm A and Firm B agree to collude and both charge…arrow_forwardDon't used Ai solutionarrow_forward
- There is Village A where the luxury axiom and the substitution axiom are satisfied (as discussed in Chapter 6). In this village, 200 households and 100 firms exist. Each household is composed of 4 household members: two adults and two children. One of the children is a teenage daughter and the other is a teenage son. The subsistence level of consumption for each individual is s = 2.5. One of the two adults in each household works on its private land and produces the value of agricultural output a = 3. The other adult earns a wage by working for a firm and decides whether to work at the firm with the two children. Regarding the labour input for firm’s production, one unit of child labour is equivalent to 0.5 units of adult labour. Accordingly, the child wage is half of the adult wage. Each firm produces output according to the following production function. Output = 16(Adult Equivalent Labour)^(1/2) We assume that the adults working on their private lands cannot work for firms. Wages,…arrow_forwardNot use ai pleasearrow_forwardPlease correct answer and don't use hand ratingarrow_forward
- I need help with #18 pleasearrow_forwardYou are assisting a small manufacturing firm in determining the optimal level of labor input (L) that maximizes profit. The analysis is based on the following production function: Q = 10L – 0.5L2 Where: Q represents the output (units produced), L represents the variable input (labor hours). Additional Information: Each unit of output is sold for $10. The firm can hire labor at a cost of $20 per hour. Please derive the following results: The Marginal Revenue Product The Marginal Factor Cost The Optimal Labor Inputarrow_forwardNot use ai pleasearrow_forward

 Essentials of Economics (MindTap Course List)EconomicsISBN:9781337091992Author:N. Gregory MankiwPublisher:Cengage Learning
 Brief Principles of Macroeconomics (MindTap Cours...EconomicsISBN:9781337091985Author:N. Gregory MankiwPublisher:Cengage Learning
 Principles of Economics 2eEconomicsISBN:9781947172364Author:Steven A. Greenlaw; David ShapiroPublisher:OpenStax