Behavioral Sciences STAT (with CourseMate Printed Access Card) (New, Engaging Titles from 4LTR Press)
2nd Edition
ISBN: 9781285458144
Author: Gary Heiman
Publisher: Cengage Learning
expand_more
expand_more
format_list_bulleted
Concept explainers
Videos
Textbook Question
Chapter 2, Problem 19SP
The following shows the distribution of final exam scores in a large introductory psychology class. The proportion of the total area under the curve is given for two segments.
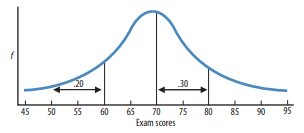
(a) Order the scores 45, 60, 70, 72, and 85 from most frequent to least frequent. (b) What is the percentile of a score of 60? (c) What proportion of the sample scored below 70? (d) What proportion scored between 60 and 70? (e) What proportion scored above 80? (f) What is the percentile of a score of 80?
Expert Solution & Answer
Want to see the full answer?
Check out a sample textbook solution
Chapter 2 Solutions
Behavioral Sciences STAT (with CourseMate Printed Access Card) (New, Engaging Titles from 4LTR Press)
Ch. 2 - What do these symbols mean? (a) N; (b) f?Ch. 2 - Why must the sum of all fs in a sample equal N?Ch. 2 - (a) What is the difference between a bar graph and...Ch. 2 - What is a dot plotted on a graph called?Ch. 2 - (a) What is the difference between a histogram and...Ch. 2 - (a) What does it mean when a score is in a tail of...Ch. 2 - Prob. 7SPCh. 2 - (a) What is the advantage of computing relative...Ch. 2 - (a) What is the difference between the polygon for...Ch. 2 - What is the difference between the graphs for a...
Ch. 2 - Prob. 11SPCh. 2 - In reading psychological research, you encounter...Ch. 2 - What type of frequency graph is appropriate when...Ch. 2 - The distribution of scores on a statistics test is...Ch. 2 - Prob. 15SPCh. 2 - (a) On a normal distribution of exam scores,...Ch. 2 - Interpret each of the following. (a) You scored at...Ch. 2 - Draw a normal curve and identify the approximate...Ch. 2 - The following shows the distribution of final exam...Ch. 2 - The following normal distribution is based on a...Ch. 2 - Organize the ratio scores below in a table andshow...Ch. 2 - Draw a simple frequency polygon using the data in...Ch. 2 - What type of graph should you create when counting...Ch. 2 - An experimenter studies vision in low light by...Ch. 2 - Prob. 25SP
Knowledge Booster


Learn more about
Need a deep-dive on the concept behind this application? Look no further. Learn more about this topic, statistics and related others by exploring similar questions and additional content below.Recommended textbooks for you
 Glencoe Algebra 1, Student Edition, 9780079039897...AlgebraISBN:9780079039897Author:CarterPublisher:McGraw Hill
 Holt Mcdougal Larson Pre-algebra: Student Edition...AlgebraISBN:9780547587776Author:HOLT MCDOUGALPublisher:HOLT MCDOUGAL
Glencoe Algebra 1, Student Edition, 9780079039897...
Algebra
ISBN:9780079039897
Author:Carter
Publisher:McGraw Hill
Holt Mcdougal Larson Pre-algebra: Student Edition...
Algebra
ISBN:9780547587776
Author:HOLT MCDOUGAL
Publisher:HOLT MCDOUGAL
The Shape of Data: Distributions: Crash Course Statistics #7; Author: CrashCourse;https://www.youtube.com/watch?v=bPFNxD3Yg6U;License: Standard YouTube License, CC-BY
Shape, Center, and Spread - Module 20.2 (Part 1); Author: Mrmathblog;https://www.youtube.com/watch?v=COaid7O_Gag;License: Standard YouTube License, CC-BY
Shape, Center and Spread; Author: Emily Murdock;https://www.youtube.com/watch?v=_YyW0DSCzpM;License: Standard Youtube License