Concept explainers
(a)
ToFind:What type of
(a)
Answer to Problem 12STP
Explanation of Solution
Given:

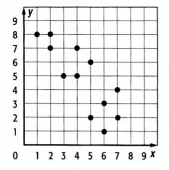
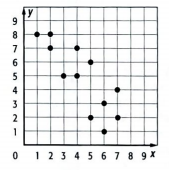
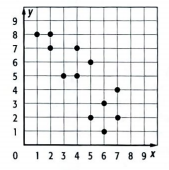
The scatter plots is having a general trend of the data which is negative.
Thus
The type of correlation is negative.
(b)
To Find: Theregression line for the data.
(b)
Answer to Problem 12STP
Explanation of Solution
Given:

By looking at the graph identify all the points
We get
Now,
Using graphing calculator enter the points to calculate the best fit line of the
We get
Hence, the regression line is
(c)
To Find: The value of
(c)
Answer to Problem 12STP
Explanation of Solution
Given:

Using the regression line
Put
Hence, the value is
Chapter 2 Solutions
Glencoe Algebra 2 Student Edition C2014
Additional Math Textbook Solutions
Thinking Mathematically (6th Edition)
Calculus: Early Transcendentals (2nd Edition)
University Calculus: Early Transcendentals (4th Edition)
Pre-Algebra Student Edition
Elementary Statistics (13th Edition)
Basic Business Statistics, Student Value Edition
- Q1lal Let X be an arbitrary infinite set and let r the family of all subsets F of X which do not contain a particular point x, EX and the complements F of all finite subsets F of X show that (X.r) is a topology. bl The nbhd system N(x) at x in a topological space X has the following properties NO- N(x) for any xX N1- If N EN(x) then x€N N2- If NEN(x), NCM then MeN(x) N3- If NEN(x), MEN(x) then NOMEN(x) N4- If N = N(x) then 3M = N(x) such that MCN then MeN(y) for any уем Show that there exist a unique topology τ on X. Q2\a\let (X,r) be the topology space and BST show that ẞ is base for a topology on X iff for any G open set xEG then there exist A Eẞ such that x E ACG. b\Let ẞ is a collection of open sets in X show that is base for a topology on X iff for each xex the collection B, (BEB\xEB) is is a nbhd base at x. - Q31 Choose only two: al Let A be a subspace of a space X show that FCA is closed iff F KOA, K is closed set in X. الرياضيات b\ Let X and Y be two topological space and f:X -…arrow_forwardQ1\ Let X be a topological space and let Int be the interior operation defined on P(X) such that 1₁.Int(X) = X 12. Int (A) CA for each A = P(X) 13. Int (int (A) = Int (A) for each A = P(X) 14. Int (An B) = Int(A) n Int (B) for each A, B = P(X) 15. A is open iff Int (A) = A Show that there exist a unique topology T on X. Q2\ Let X be a topological space and suppose that a nbhd base has been fixed at each x E X and A SCX show that A open iff A contains a basic nbdh of each its point Q3\ Let X be a topological space and and A CX show that A closed set iff every limit point of A is in A. A'S A ACA Q4\ If ẞ is a collection of open sets in X show that ẞ is a base for a topology on X iff for each x E X then ẞx = {BE B|x E B} is a nbhd base at x. Q5\ If A subspace of a topological space X, if x Є A show that V is nbhd of x in A iff V = Un A where U is nbdh of x in X.arrow_forward+ Theorem: Let be a function from a topological space (X,T) on to a non-empty set y then is a quotient map iff vesy if f(B) is closed in X then & is >Y. ie Bclosed in bp closed in the quotient topology induced by f iff (B) is closed in x- التاريخ Acy الموضوع : Theorem:- IP & and I are topological space and fix sy is continuous او function and either open or closed then the topology Cony is the quatient topology p proof: Theorem: Lety have the quotient topology induced by map f of X onto y. The-x: then an arbirary map g:y 7 is continuous 7. iff gof: x > z is "g of continuous Continuous function farrow_forward
- For the problem below, what are the possible solutions for x? Select all that apply. 2 x²+8x +11 = 0 x2+8x+16 = (x+4)² = 5 1116arrow_forwardFor the problem below, what are the possible solutions for x? Select all that apply. x² + 12x - 62 = 0 x² + 12x + 36 = 62 + 36 (x+6)² = 98arrow_forwardSelect the polynomials below that can be solved using Completing the Square as written. 6m² +12m 8 = 0 Oh²-22x 7 x²+4x-10= 0 x² + 11x 11x 4 = 0arrow_forward
- Prove that the usual toplogy is firast countble or hot and second countble. ①let cofinte toplogy onx show that Sivast countble or hot and second firast. 3) let (x,d) be matricspace show that is first and second countble. 6 Show that Indiscret toplogy is firstand Second op countble or not.arrow_forwarda) Find the scalars p, q, r, s, k1, and k2. b) Is there a different linearly independent eigenvector associated to either k1 or k2? If yes,find it. If no, briefly explain.arrow_forwardThis box plot represents the score out of 90 received by students on a driver's education exam. 75% of the students passed the exam. What is the minimum score needed to pass the exam? Submitting x and Whickers Graph Low 62, C 62 66 70 74 78 82 86 90 Driver's education exam score (out of 90)arrow_forward
- How many different rectangles can be made whose side lengths, in centimeters, are counting numbers and whose are is 1,159 square centimeters? Draw and label all possible rectangles.arrow_forwardCo Given show that Solution Take home Су-15 1994 +19 09/2 4 =a log суто - 1092 ж = a-1 2+1+8 AI | SHOT ON S4 INFINIX CAMERAarrow_forwarda Question 7. If det d e f ghi V3 = 2. Find det -1 2 Question 8. Let A = 1 4 5 0 3 2. 1 Find adj (A) 2 Find det (A) 3 Find A-1 2g 2h 2i -e-f -d 273 2a 2b 2carrow_forward
 Algebra and Trigonometry (6th Edition)AlgebraISBN:9780134463216Author:Robert F. BlitzerPublisher:PEARSON
 Contemporary Abstract AlgebraAlgebraISBN:9781305657960Author:Joseph GallianPublisher:Cengage Learning
 Linear Algebra: A Modern IntroductionAlgebraISBN:9781285463247Author:David PoolePublisher:Cengage Learning
 Algebra And Trigonometry (11th Edition)AlgebraISBN:9780135163078Author:Michael SullivanPublisher:PEARSON
 Introduction to Linear Algebra, Fifth EditionAlgebraISBN:9780980232776Author:Gilbert StrangPublisher:Wellesley-Cambridge Press
 College Algebra (Collegiate Math)AlgebraISBN:9780077836344Author:Julie Miller, Donna GerkenPublisher:McGraw-Hill Education


