
Concepts of Biology
1st Edition
ISBN: 9781938168116
Author: Samantha Fowler, Rebecca Roush, James Wise
Publisher: OpenStax College
expand_more
expand_more
format_list_bulleted
Concept explainers
Videos
Textbook Question
Chapter 19, Problem 3ACQ
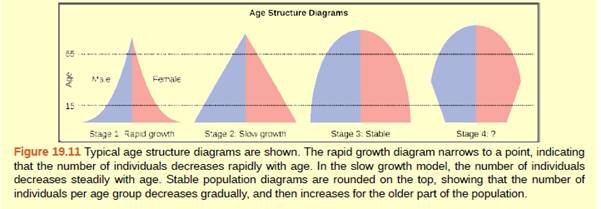
Figure 19.11 Age structure diagrams for rapidly growing, slow growing, and stable populations are shown in stages 1 through 3. What type of population change do you think stage 4 represents?
Expert Solution & Answer

Trending nowThis is a popular solution!

Students have asked these similar questions
Which country looks like it is experiencing exponential growth?
Which country looks like it has reached its carrying capacity?
Because it has reached its carrying capacity, describe the relationship between its birth rates and death rates.
Describe what is happening to Europe’s population size in terms of birth rates and death.
Which country or countries could be experiencing:
Emigration (Explain)
Immigration (Explain)
The curve below shows the growth rate of a population that
has a per capita growth rate of 0.4. Which of the following is
true about this curve. More than one is possible.
exponential growth
2500000
2000000
1500000
1000000
500000
0
5
10
15
20
25
Select one or more:
Ua. r becomes greater as the population grows because there are more births per year.
b. There are more births per generation as you move right on the graph
c. exponential growth is most often observed in stable populations that have resided in
an environment for a long time.
Od. The slope of the curve changes continuously as you move to the right even though r
remains the same.
A few plant-eating salamanders manage to float on a log to a large island in the Pacific that did not have any other salamander species previously. The salamanders find the island has abundant plants for food and no predators. On average, a salamander has four offspring per year and lives for one year.
Refer to the equation for the logistic growth model
if you were modeling salamnder population growth with this logistic growth equation, during the first few years,
a) N<K
b) N=K
c) N>K
d) there is no relationship between N and K
Chapter 19 Solutions
Concepts of Biology
Ch. 19 - Figure 19.2 As this graph shows, population...Ch. 19 - Figure 19.6 If the major food source of seals...Ch. 19 - Figure 19.11 Age structure diagrams for rapidly...Ch. 19 - Which of the following methods will provide...Ch. 19 - Which of the following is best at showing the life...Ch. 19 - Human populations have which type of survivorship...Ch. 19 - Species with limited resources usually exhibit...Ch. 19 - The maximum growth rate characteristic of a...Ch. 19 - The population size of a species capable of being...Ch. 19 - Species that have many offspring at one time are...
Ch. 19 - A forest fire is an example of ________...Ch. 19 - A country with zero population growth is likely to...Ch. 19 - Which type of country has the greatest proportion...Ch. 19 - Which of the following is not a way that humans...Ch. 19 - The first species to live on new land, such as...Ch. 19 - A symbiotic relationship where both of the...Ch. 19 - When an invasive species alters the community...Ch. 19 - Describe how a researcher would determine the size...Ch. 19 - Describe the growth at various parts of the...Ch. 19 - Give an example of how density-dependent and...Ch. 19 - Describe the age structures in rapidly growing...Ch. 19 - Describe the competitive exclusion principle and...Ch. 19 - Describe the potential effects when a keystone...
Additional Science Textbook Solutions
Find more solutions based on key concepts
A gymnast is attempting to perform splits. From the information given in Figure 9.36, calculate the magnitude a...
College Physics
Raw Oysters and Antacids: A Deadly Mix? The highly acidic environment of the stomach kills most bacteria before...
Microbiology with Diseases by Body System (5th Edition)
Match each of the following items with all the terms it applies to:
Human Physiology: An Integrated Approach (8th Edition)
15. A good scientific hypothesis is based on existing evidence and leads to testable predictions. What hypothes...
Campbell Biology: Concepts & Connections (8th Edition)
CAUTION Why does the presence of extinct forms and transitional features in the fossil record support the patte...
Biological Science (6th Edition)
One isomer of methamphetamine is the addictive illegal drug known as crank. Another isomer is a medicine for si...
Campbell Essential Biology (6th Edition) - standalone book
Knowledge Booster


Learn more about
Need a deep-dive on the concept behind this application? Look no further. Learn more about this topic, biology and related others by exploring similar questions and additional content below.Similar questions
- For each of the following, indicate if it describes what is generally a density-dependent or density independent population growth regulator. A windstorm blows all of the blue jays nests [ Choose ] out of the trees, crushing all of the blue jay eggs The size of a mouse population increases as [ Choose ] the number of predatory hawks decreases An Australian forest fire kills all of the sloths [ Choose ] An exterminator tents a house to kill all of [ Choose ] the termitesarrow_forwardPopulation growth model Notes Population growth Using discrete time steps, which is easier to describe that continuous change, the model for population growth is this: N₁ Try changing the blue numbers, for "r" (rate) and "N0" (start population), below. r: No: Nort Moose: 1.5 House fly: 80 *** 80 Time step (t) (N) Population at end of time step (N₁) 2 0 1 2 3 4 5 6 7 8 9 10 Wolf: 1.2 Z żż ź żż žžžžž ž Cockroach: 40 2 N₁ 160 No 12800 1024000 81920000 6553600000 5.24288E+11 4.1943E+13 3.35544E+15 2.68435E+17 N10 2.14748E+19 N₂ N3 N4 N5 N6 Try these hypothetical "r" values to begin, then try new numbers of your own: N7 N8 N9 Rabbit: 5 Endangered tiger: 0.8arrow_forwardWhat is the key characteristic of a population exhibiting a type II survivorship curve? large numbers of small offspring all individuals of all ages have an equal chance of dying younger individuals have a greater chance of survival younger individuals are more likely to die than other individualsarrow_forward
- In the age structure diagram below, which of the following is true of this 2 points population? 100+ 95-99 90 - 94 85 - 89 80 - 84 75-79 70 - 74 65 69 60 - 64 55 - 59 50 - 54 45 - 49 40 - 44 35 - 39 30-34 25 29 20 - 24 15 19 10 - 14 5-9 0.4 295 236 177 118 59 59 118 177 236 295 Population (in thousands) Age Group Population (in thousands) It is from a developed country. It is stable. It is expanding. It is from a developing country. It is declining. This is a reguired questionarrow_forwardThe discrete logistic function (the one you can solve with your calculator) has a time lag built in = one generation. What would a greater time lag do to the outcome? increase the chances of population exceeding K decrease the chances of population exceeding K slow down population growth by decreasing r increase population growth by increasing r it would have little/no effect under all circumstancesarrow_forwardFor Questions 1–6, write True if the statement is true. If the statement is false, change the underlined word to make the statement true | 1-Limiting factors determine the immigration capacity of a population. |2-A limiting factor controls the growth of a population. -3. Limiting factors operate when growth is exponential. 4- Populations grow too large in the absence of limiting factor 5-Competition is an example of a limiting factor. 6-Population size can be limited by factors such as predation. 7- What is a density dependent limiting factor? 8-When do density-dependent factors operate most strongly? 9-What are four density-dependent limiting factors?arrow_forward
- There are 10 people in age class 0, 10 in age class 1 and 5 in age class 2. Annual survival rates are S0=0.7, S1=0.5 and S2=0. The fecundities are F0=0, F2=1 and F2=5. What is the asymptotic population growth rate and it is reached after approximately how many years of population growth?arrow_forwardGiven the following figure of logistic growth, Logistic Growth D A Time when the population reaches point C on the figure, we can conclude that: birth rate is greater than death rate the population has surpassed carrying capacity death rate is equal to birth rate death rate is greater than birth rate Population sizearrow_forwardIf each adult female powerful owl produces 1 female juvenile (F) each year, the adult survival rate (Sa) is 0.8, the juvenile survival rate (Sj) is 0.4, and the population is N2022=1400 adult females and 1400 juvenile females in 2022, what will be the female population size in 2027 (N2027)? Show your calculations. (hint: use excel to set up a model and check your work)arrow_forward
- Population growth model Notes Population growth Using discrete time steps, which is easier to describe that continuous change, the model for population growth is this: N₁ Try changing the blue numbers, for "r" (rate) and "N0" (start population), below. 80 Time step (t) (N) Population at end of time step (N₁) 2 0 1 2 3 4 5 6 7 8 9 10 r: No: Nort Moose: 1.5 House fly: 80 *** Wolf: 1.2 Z żż ź ż żž Ž ž ž ź ż Cockroach: 40 2 N₁ 160 No N₂ 12800 1024000 81920000 6553600000 5.24288E+11 4.1943E+13 3.35544E+15 2.68435E+17 N10 2.14748E+19 N3 N4 N5 N6 Try these hypothetical "r" values to begin, then try new numbers of your own: N7 N8 N9 Rabbit: 5 Endangered tiger: 0.8arrow_forwardThis graph plots the difference between birth rates and death rates in Mexico during the 20th century. During which quarter century did Mexico experience the greatest rate of population growth? a) 1900–1925 50 b) 1925–1950 40 c) 1950–1975 Rate of 30 increase d) 1975–2000 20 Birth rate Death rate 10 1900 1925 1950 1975 2000 2025 2050 Year Adapted from Transitions in World Population, Population Bulletin 59: 1 (2004). © 2018 Pearson Education, Inc. Birth or death rate per 1,000 populationarrow_forwardS2) Below are two tables showing the population size and deaths by age for one year in the states of Louisiana (LA) and Florida (FL). Use the data to answer the following questions. You may use the blank cells in the tables for calculations and to show answers Age group 0-15 16-70 71+ Louisiana Deaths 30 215 585 Florida Age group Deaths 0-15 16-70 71+ 25 400 725 Population 165,000 300,000 75,000 Population 90,000 435,000 225,000 a. Calculate the overall crude mortality rates for LA and FL expressed as per 100,000 population. LA: FL: b. Calculate the age-adjusted mortality rates using the combined population as the standard. c. Explain what accounts for this difference in crude rates and adjusted rates between LA and FL.arrow_forward
arrow_back_ios
SEE MORE QUESTIONS
arrow_forward_ios
Recommended textbooks for you
 Biology 2eBiologyISBN:9781947172517Author:Matthew Douglas, Jung Choi, Mary Ann ClarkPublisher:OpenStax
 Concepts of BiologyBiologyISBN:9781938168116Author:Samantha Fowler, Rebecca Roush, James WisePublisher:OpenStax College
 Biology (MindTap Course List)BiologyISBN:9781337392938Author:Eldra Solomon, Charles Martin, Diana W. Martin, Linda R. BergPublisher:Cengage Learning
Biology 2e
Biology
ISBN:9781947172517
Author:Matthew Douglas, Jung Choi, Mary Ann Clark
Publisher:OpenStax
Concepts of Biology
Biology
ISBN:9781938168116
Author:Samantha Fowler, Rebecca Roush, James Wise
Publisher:OpenStax College
Biology (MindTap Course List)
Biology
ISBN:9781337392938
Author:Eldra Solomon, Charles Martin, Diana W. Martin, Linda R. Berg
Publisher:Cengage Learning
POPULATION REGULATION AND LIMITING FACTORS | DENSITY INDEPENDENT AND DENSITY DEPENDENT FACTORS; Author: BioVidyalaya;https://www.youtube.com/watch?v=mB-AB-5Wnhs;License: Standard YouTube License, CC-BY
Population growth; Author: SiouxScience;https://www.youtube.com/watch?v=XnaC9iOumVA;License: Standard YouTube License, CC-BY