
(a):
(a):
Explanation of Solution
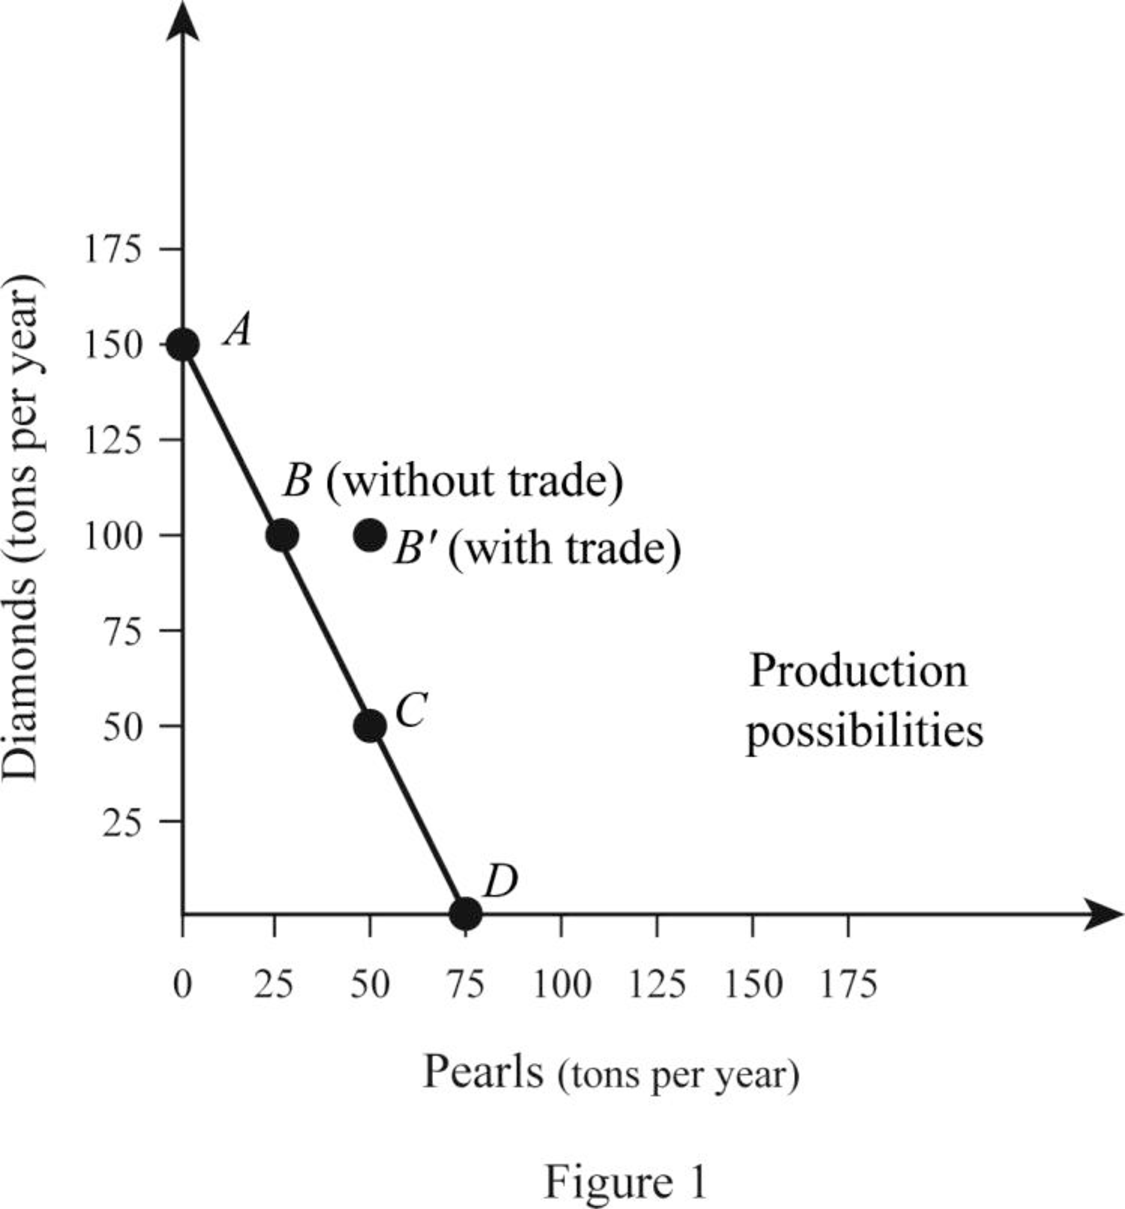
The opportunity cost of producing a commodity can be calculated by dividing the total quantity of Pearls lost with the Diamonds gained for the country. Country A produces either 150 tons of Diamonds or 75 ton of Pearls. Thus, the opportunity cost can be calculated as follows:
Therefore, the opportunity cost of producing a ton of Diamond is
Thus, the opportunity cost of producing a ton of Diamond for Country B is equal to 2 tons of Pearls.
Opportunity cost: Opportunity cost is the cost of the next best alternatives that is foregone while making the choices. When the resources are used for the production of Commodity A, Commodity B that could be made with that same quantity of resource will be the opportunity cost.
(b):
Opportunity cost of producing Pearls.
(b):
Explanation of Solution
The opportunity cost of producing Pearl can be calculated by dividing the total quantity of Diamonds lost with the Pearls gained for the country. Country A produces either 150 tons of Diamonds or 75 ton of Pearl. Thus, the opportunity cost can be calculated as follows:
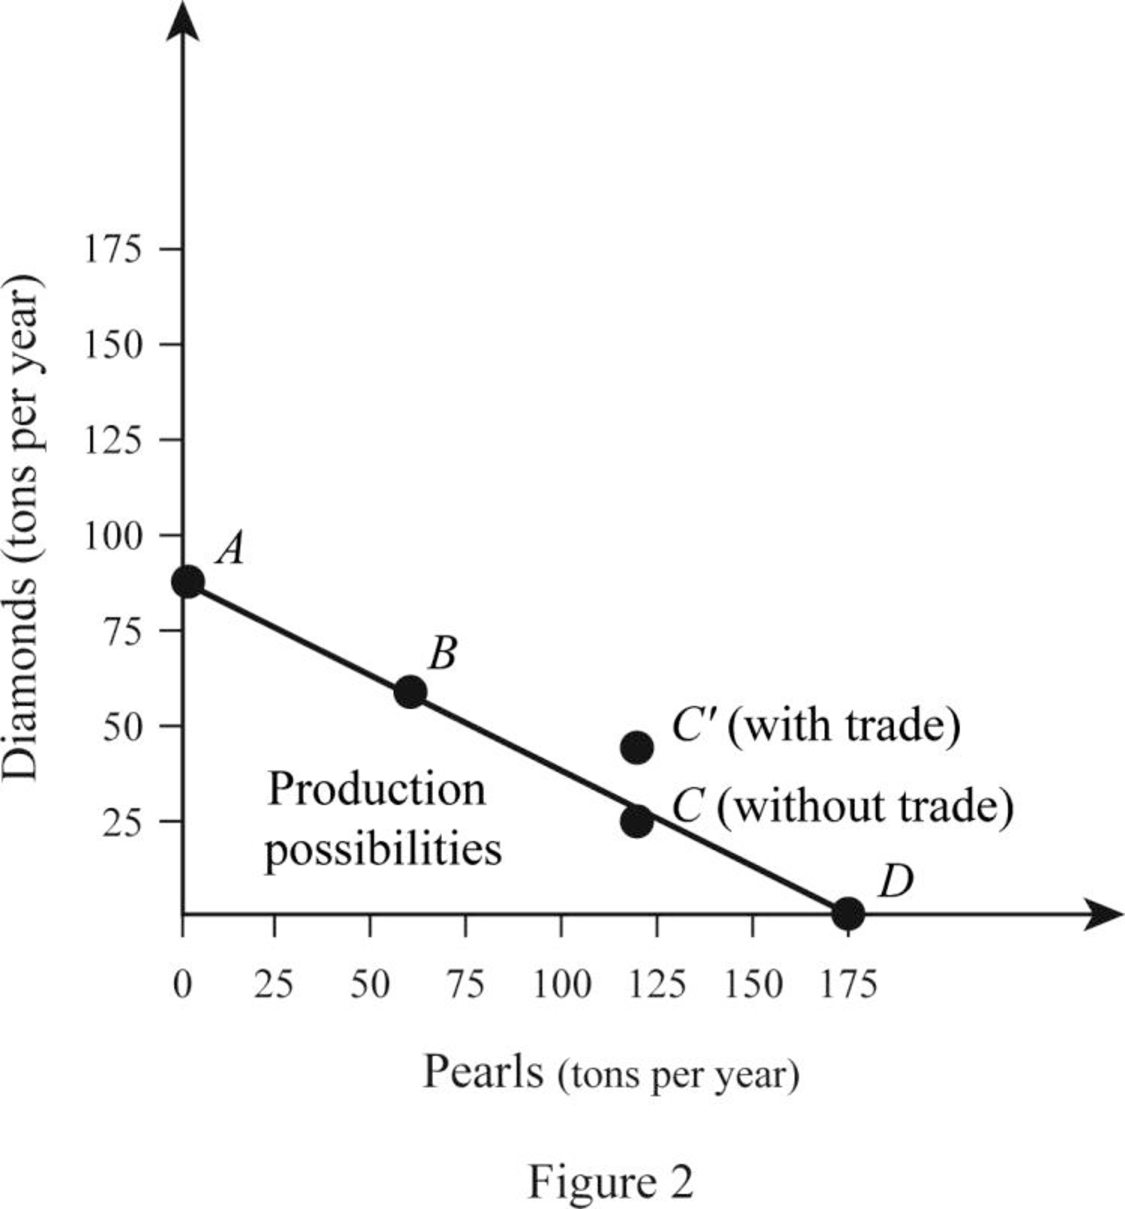
Therefore, the opportunity cost of producing a ton of Pearl is 2 tons of Pearls in Country A. Similarly, Country B can produce either 90 tons of Diamonds or 180 tons of Pearls. Thus, the opportunity cost of producing Pearl for B can be calculated as follows:
Thus, the opportunity cost of producing a ton of Pearl for Country B is equal to
(c):
Commodity in which A has a
(c):
Explanation of Solution
The
In the case of Country A, the opportunity cost of producing a ton of Diamond is
(d):
Commodity in which Country B has a comparative advantage.
(d):
Explanation of Solution
In the case of Country A, the opportunity cost of producing a ton of Diamond is
From this, it can be identified that Country B could produce Pearls at a lower opportunity cost than Country A. This indicates that Country B has comparative advantage in the production of Pearls.
(e):
Benefit of specialization.
(e):
Explanation of Solution
Country A is in its PPC Curve B where it produces 100 tons of Diamonds and 25 tons of Pearls. Country B is on its PPC curve C where it produces 30 tons of Diamonds and 120 tons of Pearls. Thus, the total output is 130 tons of Diamonds and 145 tons of Pearls. When the country specializes, Country A produces only Diamonds, which is 150 tons and B produces only Pearls, which is 180 tons. Thus, the total output increases due to specialization by 20 tons of Diamonds and 35 tons of Pearls. This can be illustrated in a table as follows:
| Diamonds (in tons per year) | Pearls (In tons per year) | |
| Before Specialization | ||
| A (PPC point at B) | 100 | 25 |
| B (PP C point at C) | 30 | 120 |
| Total Output | 130 | 145 |
| After Specialization | ||
| A (PPC point at A) | 150 | 0 |
| B (PP C point at D) | 0 | 180 |
| Total Output | 150 | 180 |
Thus, the total output of Diamonds and Pearls increases as the economy specializes in the production of commodities in which they have comparative advantages.
(f):
Graphical representation of specialization and trade benefit for the countries.
(f):
Explanation of Solution
When there is no specialization and trade between A and B, Country A operates at PPC point B where it produces and consumes 100 tons of Diamonds and 25 tons of Pearls. The case with Country B is different and it operates at Point C of the PPC where it produces and consumes 30 tons of Diamonds and 120 tons of Pearls. When the country specializes, Country A produces 150 tons of Diamonds and Country B produces 180 tons of pearls.
When the trade takes place, Country A trades 50 tons of Diamonds in exchange for 50 tons of Pearls with Country B. This means that Country A is able to consume 100 tons of Diamonds and 50 tons of Pearl whereas Country B is able to consume 50 tons of Diamonds and 130 tons of Pearls. Thus, both countries are able to achieve a consumption point beyond their PPC which can be illustrated as follows:
Want to see more full solutions like this?
Chapter 18 Solutions
MACROECONOMICS FOR TODAY

- In Japan, one worker can make 5 tons of rubber or 80 radios. In Malaysia, one worker can make 10 tons of rubber or 40 radios. In what product should Japan specialize? In what product should Malaysia specialize? If Malaysia wishes to trade 10 tons of rubber with Japan in exchange for radios, what is the lowest number of radios it should ask for in order to benefit from trade? What is the largest number of radios Japan can offer in order to benefit from trade?arrow_forwardHappyland can produce 40 tones of marshmallows or 20 tones of chocolate in a year. Friendshipland can produce 80 tones of marshmallows or 40 tones of chocolate in a year. Can these countries benefit from trade with each other based on specialization and comparative advantage? Yes Noarrow_forwardAmerican and Japanese workers can each produce 4 cars a year. An American worker can produce 10 tons of grain a year, whereas a Japanese worker can produce 5 tons of grain a year. Each country has 100 million workers. Who has the absolute advantage in the production of cars? Who has the absolute advantage in the production of grains? Who has a comparative advantage in the production of cars? Who has a comparative advantage in the production of cars? What is the opportunity cost for cars ?arrow_forward
- Assuming specialization and free trade and using the data in the previous question, if Country A imports 40 TV's and exports 80 wheat, consumption in Country A will be: Wheat Country A Wheat Country B 200 80 50 Television Sets 80 Television Sets 200 wheat and 40 TV's. 280 wheat and 90 TV's. 120 wheat and 80 TV's 120 wheat and 40 TV'sarrow_forwardNow suppose that if Zimbabwe uses all of its resources, it can produce 50,000 tons of metal ores or 100,000 delivery trucks (trading off at a constant rate). Suppose that if South Africa uses all of its resources, it can produce 20,000 tons of metal ores or 80,000 delivery trucks (trading off at a constant rate). What is the direction of trade (who exports what to whom)? Be sure to give the opportunity costs of production of both goods for both countries. What is one potential price of metal ores in terms of trucks at which both Zimbabwe and South Africa would benefit from trade? Rank the autarkic prices and the world price of metal ores from lowest to highest.arrow_forwardThere are two countries, Atlantis and Thule, and two goods, Clothing (C) and food (F) In Atlantis, it takes 3 units of labour to produce a unit of Clothing and 3 units of labour to make a unit of Food. In Thule, a unit of Clothing requires 2 units of labour, and a unit of Food requires 5 units of labour. Assume that Atlantis has 300 units of labour, and Thule has 500 units of labour. (a) What is the opportunity cost of Food in terms of Clothing in each country? (b) Which country has an absolute advantage in which good? (c) Which country has a comparative advantage in which good? Why? (d) Draw the production possibilities frontier for each country (put Food on the horizontal axis). Label axes and slopes. (e) Draw the world production possibilities frontier (assuming labour does not move between countries). Again, put Food on the horizontal axis. Label axes and important points on - 2 - the diagram. (f ) Draw the world relative supply curve (labelled RS) for F/C with the relative price…arrow_forward
- Consider two countries, the U.S. and Bangladesh, trading two goods, shoes and food. There are two factors of production, labor and capital. Assume that the production of shoes is relatively more capital intensive than the production of food in the U.S. Instead, the production of shoes is relatively more labor intensive in Bangladesh than the production of food. Assume that the U.S. is the capital abundant country and that Bangladesh is labor abundant. Both goods are produced by both countries in equilibrium. Illustrate the initial factor prices and factor intensities in a carefully drawn and labeled diagram with capital on the y-axis and labor on the x-axis, and indicate the cone(s) of diversification. Assume that the world price of shoes declines, but that both countries' continue to produce both goods. Illustrate the effect of this change in either the same or a new diagram. How do the real returns to both factors change in the two countries? Explain whether your findings are…arrow_forwardSuppose Country A can produce 200 tons of capital-intensive goods or 200 tons of labor-intensive goods in one day. Suppose Country B can produce 80 tons of capital-intensive goods or 160 tons of labor-intensive goods in one day. What is one possible price of capital-intensive goods (in terms of labor-intensive goods) that would make BOTH countries better off as the result of trade?arrow_forwardAssume that Germany has 1200 units of labor available and it can produce two goods: apples and bananas. The unit labor requirement in apple production is 3, while in banana production it is 2. France has a labor force of 800. France’s unit labor requirement in apple production is 5, while in banana production it is 1. How many total units of apples and bananas will be produced in the world after trade?arrow_forward
- Based on Comparative advantage, what factors have helped the united states to become the world's leading exporter of movies, books and popular music?arrow_forwardLabor productivity coefficients for the US and Brazil are given by the following table: Country Wheat per week Clothing per week Labor(number of workers) United States 2 8 100 Brazil 1 2 120 Solve for: Who has the absolute advantage in wheat? What is the opportunity cost of 1 unit of wheat in the US? in Brazil? What is the opportunity cost of 1 unit of clothing in the US? in Brazil? Who has the comparative advantage in Wheat? In Clothing? Draw the production possibility frontier for the US. (Put Wheat on the Y-axis and Clothing on the X-axis) For Brazil (Put Wheat on the Y-axis and Clothing on the X-axis) Suppose each country decides to split its labor force equally on the production of each good. Locate the point on the PPF curve for each country that represents this allocation of labor. What’s their production and consumption combination # at this point?arrow_forwardThe table below for the United States and Mexico shows maximum feasible production rates per acre of wheat if no rice is produced and maximum feasible production rates per acre of rice if no wheat are produced. Assume that the opportunity costs of producing these goods are constant in both countries. Output per Acre with Trade Wheat 80 tons United States Mexico 55 tons For the United States, the opportunity cost of 1 ton of wheat is tons of rice. (Enter your response rounded to two decimal places.) has a comparative advantage in wheat, and has a comparative advantage in rice. Now consider the following table that shows the production and consumption of wheat and rice if there is no trade. Output per Acre with No Trade Wheat 40.0 tons 27.5 tons United States Mexico Total output of wheat if the two countries do not trade tons. (Enter your response rounded to one decimal place.) Total output of rice if the two countries do not trade tons. (Enter your response rounded to one decimal place)…arrow_forward


 Economics (MindTap Course List)EconomicsISBN:9781337617383Author:Roger A. ArnoldPublisher:Cengage Learning