Concept explainers
Videos
(a)
Find the sample mean.
Find the median.
(a)
Answer to Problem 13E
The sample mean is 124.3.
The median is 120.
Explanation of Solution
Calculation:
Step-by-step procedure to obtain the mean and median using MINITAB software:
- Choose Stat > Basic Statistics > Display
Descriptive Statistics . - In Variables enter the column hour.
- Choose option statistics, and select Mean, Median.
- Click OK.
Output obtained using MINITAB software is given below:
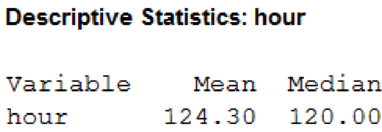
From the MINITAB output, the sample mean is 124.3, and the median is 120.
(b)
Identify the feature in this data set that is responsible for the substantial difference between the two.
(b)
Explanation of Solution
Step-by-step procedure to obtain the boxplot using MINITAB software:
- Choose Graph > Boxplot.
- Under One Y, choose Simple. Click OK.
- In Graph variables, enter the data of hour.
- Click OK.
Output obtained using MINITAB software is given below:
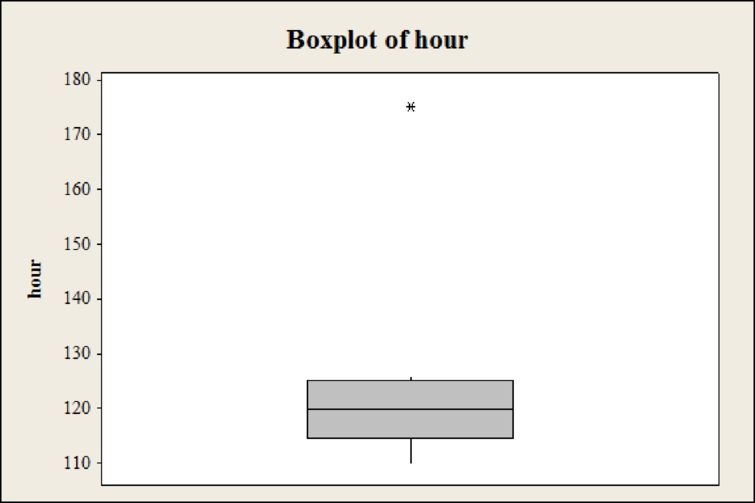
From the boxplot, it is clear that the observation 175 is an extreme value when compared to the remaining observations.
Want to see more full solutions like this?
Chapter 1 Solutions
Pearson eText for Probability & Statistics for Engineers & Scientists, Digital Update -- Instant Access (Pearson+)


 MATLAB: An Introduction with ApplicationsStatisticsISBN:9781119256830Author:Amos GilatPublisher:John Wiley & Sons Inc
 Probability and Statistics for Engineering and th...StatisticsISBN:9781305251809Author:Jay L. DevorePublisher:Cengage Learning
 Statistics for The Behavioral Sciences (MindTap C...StatisticsISBN:9781305504912Author:Frederick J Gravetter, Larry B. WallnauPublisher:Cengage Learning
 Elementary Statistics: Picturing the World (7th E...StatisticsISBN:9780134683416Author:Ron Larson, Betsy FarberPublisher:PEARSON
 The Basic Practice of StatisticsStatisticsISBN:9781319042578Author:David S. Moore, William I. Notz, Michael A. FlignerPublisher:W. H. Freeman
 Introduction to the Practice of StatisticsStatisticsISBN:9781319013387Author:David S. Moore, George P. McCabe, Bruce A. CraigPublisher:W. H. Freeman