
(a)
Draw the scatter diagram.
(a)
Explanation of Solution
Figure 1 shows the scatter diagram of Y and X.
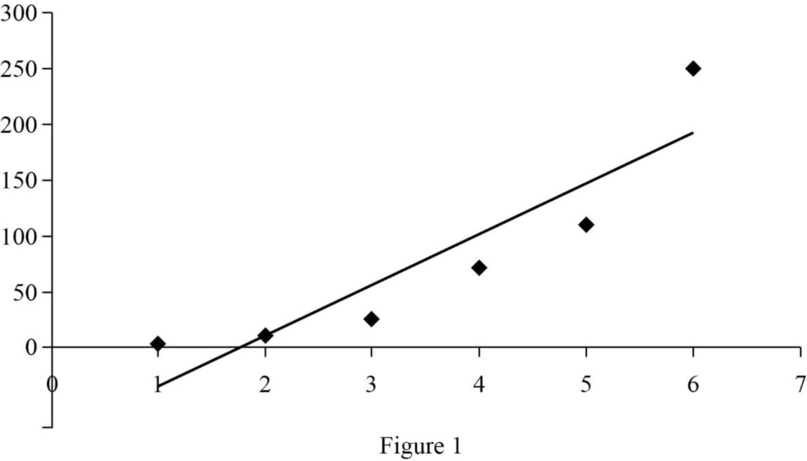
In the above figure, the position of the scatters shows a positive relationship between variables Y and X.
Scatter diagram: The scatter diagram shows the value of two variables plotted along two axes. Each scatter represents the relationship between the variables.
(b)
Calculate the linear relationship.
(b)
Explanation of Solution
The least squares regression line is shown below:
Where b0 is the y-intercept and b1 is the slope of the regression line.
The least squares regression line is calculated as follows:
Table 1
| Xi | Yi | Xi2 | Yi2 | XiY1 | |
| 1 | 3 | 25 | 9 | 625 | 75 |
| 2 | 5 | 110 | 25 | 12100 | 550 |
| 3 | 2 | 9 | 4 | 81 | 18 |
| 4 | 6 | 250 | 36 | 62500 | 1500 |
| 5 | 1 | 3 | 1 | 9 | 3 |
| 6 | 4 | 71 | 16 | 5041 | 284 |
| Total | 21 | 468 | 91 | 80,356 | 2,430 |
These table values are obtained using a spreadsheet.
This calculation is enough evidence to conclude that variables X and Y are in a linear relationship.
Want to see more full solutions like this?
Chapter 16 Solutions
Statistics for Management and Economics (Book Only)

- You must identify the relationship between housing price and size. In this experiment, you have collected data from four major cities, namely Birmingham, Manchester, Bristol and Glasgow. What method is suitable for studying this project? Give an explanation.arrow_forwardHow would you describe a correlation of -1? Group of answer choices There is a perfect linear relationship between x and y. There is a strong positive relationship between x and y. There is no relationship between x and y. There is a weak negative relationship between x and y. thanksarrow_forwardYou are given the following dataset from a sample of the population. Superhero Number of Villains Captured Number of Losses Average Hours of Sleep Spiderham 30 9 12 Alligator Loki 50 1 23 Iron Man 20 8 6 Phil Coulson 18 2 8 Yelena Belova 25 5 2 Round all answers to 2 decimal places. IE: 3.567 = 3.57 D. Calculate the correlation between the number of villains captured and average hours of sleep . If answer is negative, include negative sign. E. Calculate the sample covariance between the average number of losses and average hours of sleep . If answer is negative, include negative sign.arrow_forward
- The last digit of the heights of 67 statistics students were obtained as part of an experiment conducted for a class. Use the following frequency distribution to construct a histogram. What can be concluded from the distribution of the digits? Specifically, do the heights appear to be reported or actually measured? Digit Frequency 0 15 5 5 1 T Choose the correct histogram below. O A. O B. O C. D. 18- 56789 0123456789 ܩܫܠ 6789 123456789 Are the data reported or measured? O A. The data appears to be measured. The heights occur with roughly the same frequency. O B. The data appears to be measured. Certain heights occur a ..arrow_forwardA rectangle is a four-sided figure that has two sets of parallel sides, so that we have two sides of one length and two sides of another length; a square is just a special case of a rectangle in which all four sides are the same length. Therefore, the procedure for calculating area is the same no matter whether we are dealing with a rectangle or a square. The area of a rectangle is calculated as follows: Area = base x height = b × h In this formula, the base is the width of the rectangle and the height is simply how tall the rectangle Is. For example, if we have a rectangle that is 20 centimeters wide and 10 centimeters tall, its area can be calculated as follows: Area = 20 cm x 10 cm = 200 cm² Note the superscript '2' In our answer; this is because we have multiplied centimeters by centimeters. In economics, we are more likely to be dealing with quantities bought or sold and prices, so don't worry about it too much for our discussion. The area of a triangle A triangle is really just a…arrow_forwardA rectangle is a four-sided figure that has two sets of parallel sides, so that we have two sides of one length and two sides of another length; a square is just a special case of a rectangle in which all four sides are the same length. Therefore, the procedure for calculating area is the same no matter whether we are dealing with a rectangle or a square. The area of a rectangle is calculated as follows: Area = base x height = b × h In this formula, the base is the width of the rectangle and the height is simply how tall the rectangle Is. For example, if we have a rectangle that is 20 centimeters wide and 10 centimeters tall, its area can be calculated as follows: Area = 20 cm x 10 cm = 200 cm² Note the superscript '2' In our answer; this is because we have multiplied centimeters by centimeters. In economics, we are more likely to be dealing with quantities bought or sold and prices, so don't worry about it too much for our discussion. The area of a triangle A triangle is really just a…arrow_forward
- A rectangle is a four-sided figure that has two sets of parallel sides, so that we have two sides of one length and two sides of another length; a square is just a special case of a rectangle in which all four sides are the same length. Therefore, the procedure for calculating area is the same no matter whether we are dealing with a rectangle or a square. The area of a rectangle is calculated as follows: Area = base x height = b × h In this formula, the base is the width of the rectangle and the height is simply how tall the rectangle Is. For example, if we have a rectangle that is 20 centimeters wide and 10 centimeters tall, its area can be calculated as follows: Area = 20 cm x 10 cm = 200 cm² Note the superscript '2' In our answer; this is because we have multiplied centimeters by centimeters. In economics, we are more likely to be dealing with quantities bought or sold and prices, so don't worry about it too much for our discussion. The area of a triangle A triangle is really just a…arrow_forwardif the relationship between two variables is linear and the coefficient of determination (R2) has a value near 1, the scatter diagram has what appearance?arrow_forward(6) Given the following sample data set. X 2 3 Y 10 9 a. Draw a scatter diagram of the data. 5 7 6 4 6 2 b. Compute the correlation coefficient r. Then use 0.05 significance level to test whether there is a linear correlation between x and y. Assume requirement satisfied.arrow_forward
- U.S. Population The U.S. population can be modeledby the function y = 165.6x1.345, where y is in thousands and x is the number of years after 1800.a. What was the population in 1960, according tothis model?b. Is the graph of this function concave up or concave down? What does this mean?c. Use numerical or graphical methods to findwhen the model estimates the population to be93,330,000.arrow_forward265 guizres/276906/take Grouping Information Using the lukey Method and .unf.educ Grouping ActivityT N Mean 9 145 444 A shop B. date 9 62.333 Means that do not share a letter are significantly different. Tukey Pairwise Comparisons: Age Grouping Information Using the Tukey Method and 95% Confidence Age N Mean Grouping mid 6 137.167 A old 6 98.500 A B. yng 6 76.000 Means that do not share a letter are significantly different O Marketers should focus on middle age rather than younger groups O Marketers should not pay more for access to middle age rather than older groups O All of the answers are correct. O Marketers should not pay more for access to older groups vs younger groupsarrow_forwardA wedding photographer made $500 on average in the 5 years it has been operational. Asample of 12 months were analyzed and it was found that he made an average of $620.i. Does the value $500 refer to the parameter or to the statistic? ii. Is the value $620 a parameter or a statistic? iii. State two advantages of using a sample statistic rather than a parameter.arrow_forward
 Managerial Economics: Applications, Strategies an...EconomicsISBN:9781305506381Author:James R. McGuigan, R. Charles Moyer, Frederick H.deB. HarrisPublisher:Cengage Learning