
(a)
Draw the scatter diagram.
(a)
Explanation of Solution
Figure 1 shows the scatter diagram of Y and X.
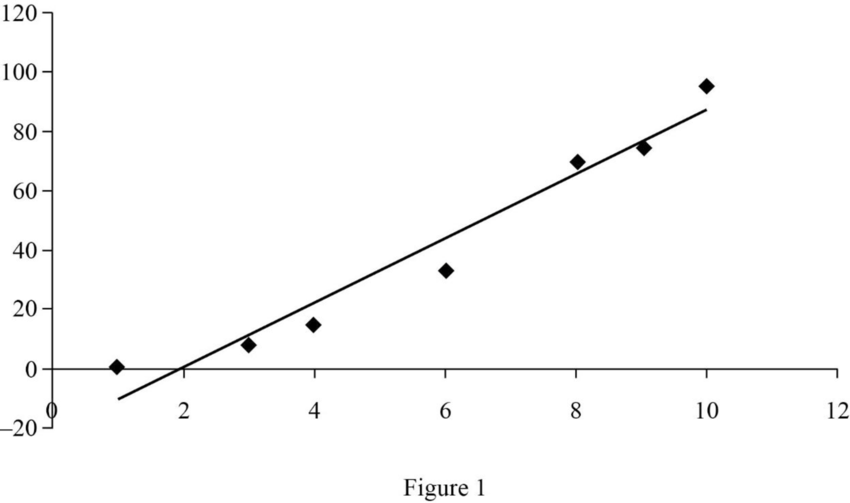
In the above figure, the position of the scatters shows a positive relationship between variables Y and X.
Scatter diagram: The scatter diagram shows the value of two variables plotted along two axes. Each scatter represents the relationship between the variables.
(b)
Calculate the linear relationship.
(b)
Explanation of Solution
The least squares regression line is shown below:
Where b0 is the y-intercept and b1 is the slope of the regression line.
The least squares regression line is calculated as follows:
Table 1
| Xi | Yi | Xi2 | Yi2 | XiY1 | |
| 1 | 1 | 1 | 1 | 1 | 1 |
| 2 | 3 | 8 | 9 | 64 | 24 |
| 3 | 4 | 15 | 16 | 225 | 60 |
| 4 | 6 | 33 | 36 | 1089 | 198 |
| 5 | 9 | 75 | 81 | 5625 | 675 |
| 6 | 8 | 70 | 64 | 4900 | 560 |
| 7 | 10 | 95 | 100 | 9025 | 950 |
| Total | 41 | 297 | 307 | 20,929 | 2,468 |
These table values are obtained using a spreadsheet.
This is evidence to conclude that variables X and Y are in a linear relationship.
Want to see more full solutions like this?
Chapter 16 Solutions
Statistics for Management and Economics (Book Only)

- A manufacturer of cat food was planning to survey households in the US to determine purchasing habits of cat owners. Among the questions to be included are those that relate to Where cat fat is primarily purchased. Whether dry or moist cat food is purchased. The number of cats living in the household. Whether the cat is pedigreed. Describe the population. For each of the four items listed, indicate whether the variable is categorical or numerical.arrow_forwardOA large city hospital conducted a study to investigate the relationship between the number of unauthorized days that employees are absent per year and the distance (miles) between home and work for the employees. A sample of 10 employees was selected and the following data were collected. D Excel file: data14-13.xlsx Distance to Work Number of Days (miles) Absent 8. 8. 9. 8 6. 10 12 14 14 4 18 If required, enter negative values as negative numbers. a. Select the correct scatter diagram for these data. A. Number of Days Absent 10+ 8+ . 6- 2+ 8. 10 12 14 16 18 20 Distance to Work (miles) 4.arrow_forwardUBC coaching center has two branches in Dhaka: one in Dhanmondi (Branch A) and another one in Mohammadpur (Branch B). To understand their students' performance, the coaching center conducts the same test in both branches. A sample of 8 students have been selected from branches A and B respectively, and the following table shows data on their performance. Use appropriate non-parametric methods on the data to find out whether there is a statistically significant correlation between the ranks of the students’ performance of the two branches.?arrow_forward
- Why can we not use first differences when we have independent cross sections in two years (as opposed to panel data)?arrow_forwardQUESTION 39 A researcher reports an independent-measures t-statistic with degrees of freedom = 38 . How many participants were in the entire study? 20 40 39 76arrow_forwardProduct Quality Value for Money Ease of use 0.8 0.6 0.7 21 0.2 0.5 0.8 3. 0.6 0.3 0.5 4 (Proposed) 0.4 0.7 0.1 Importance weight I 1.6 A company conducted a survey of shoppers to understand customer buying habits and determine the share of shoppers that a new product might attract. The customer rated three existing products and one proposed new product on three dimensions: 1.Quality, 2. Durability, and 3. Ease of use. The results of this survey are shown in the following table. The expected market share for the new proposed product (product number 4) is: (2.0) A. 46.3 В. 25.2 C. 15.1 D. 11.6 20.0 E.arrow_forward
- et R2unrestricted and R2restricted be 0.54 and 0.30 respectively. The difference between the unrestricted and the restricted model is that you have imposed two restrictions. The number of regressors in the unrestricted model is 5. There are 500 observations. The F-statistic (under the assumption of homoskedasticity) in this case is 1. 4.61 2. 8.01 3. 98.5 4. 128.9arrow_forwardAn economist collects data regarding the number of jobs an individual has held by age 21. Tim states he had 4 jobs, Sam had 3, Jill had 3, Sally had 2, and Watney had 10.An economist should use the to draw conclusions. A typical individual had jobs by the age 21.arrow_forwardA life insurance company wishes to examine the relationship between the amount of life insurance held by a family and family income. From a random sample of households, the company collected the accompanying INCOME 97 INSUR 38 data. The data are in units of thousands of dollars. INSUR 141 29 Let y = 280 75 X = INCOME 303 81 453 137 357 77 199 43 251 53 807 184 147 45 272 70 537 128 527 117 245 55 483 116 673 204 194 46 154 51 163 48 280 69 507 140 464 136 321 71 873 206 476 144 574 111 251 65 497 130 826 171 133 32 259 82 281 73 446 146 3 The vertical intercept of the estimated regression equation is 332 77 a 11.009 219 48 b 9.830 208 55 8.776 180 48 d 7.836 169 42 273 69 502 127 547 126 281 80 428 143 370 77 221 49 214 51arrow_forward
- In a study aimed at creating reference values, abdominal circumference (measured in cm) was measured in adult men. It was found that the relationship to age could be described as abdominal circumference = 82 + 0.3 x age a) What is the analysis that produces such a formula called? b) At what age is the average abdominal circumference 100 cm?arrow_forwardFocusing on government spending as a percentage of GDP in the U.S., we observed that between 1820 and 1929 the: minimum value was 3.13%; mean value was 6.83%; and maximum value was 29.03%. In contrast, between 1930 and 2021 , the a) None of the above answers are correct. B) maximum value was 10.94%.c) minimum value was 2.12%. D) mean value was 30.56%. Note:- Do not provide handwritten solution. Maintain accuracy and quality in your answer. Take care of plagiarism. Answer completely. You will get up vote for sure.arrow_forwardRecently the European Community (EC) decided to lower its subsidies to makers of pasta. In deciding by what amount to reduce total subsidies, experiments were carried out for determining the possible reduction in exports, mainly to the United States, that would result from the subsidy reduction. Over a small range of values, economists wanted to test whether there is a positive correlation between level of subsidy and level of exports. A computer simulation of the economic variables involved in the pasta exports market was carried out. The results follow. Assuming that the simulation is an accurate description of reality and that the values obtained may be viewed as a random sample of the populations of possible outcomes, state whether you believe that a positive rank correlation exists between subsidy level and exports level over the short range of values studied Qarrow_forward

 Principles of Economics (12th Edition)EconomicsISBN:9780134078779Author:Karl E. Case, Ray C. Fair, Sharon E. OsterPublisher:PEARSON
 Engineering Economy (17th Edition)EconomicsISBN:9780134870069Author:William G. Sullivan, Elin M. Wicks, C. Patrick KoellingPublisher:PEARSON
 Principles of Economics (MindTap Course List)EconomicsISBN:9781305585126Author:N. Gregory MankiwPublisher:Cengage Learning
 Managerial Economics: A Problem Solving ApproachEconomicsISBN:9781337106665Author:Luke M. Froeb, Brian T. McCann, Michael R. Ward, Mike ShorPublisher:Cengage Learning
 Managerial Economics & Business Strategy (Mcgraw-...EconomicsISBN:9781259290619Author:Michael Baye, Jeff PrincePublisher:McGraw-Hill Education