Concept explainers
Videos
To find:
The graph, that, best represents a participant in a triathlon, under giving conditions.
Answer to Problem 32PPS
Graph B that best represents a participant in a triathlon.
Explanation of Solution
Given information:
In a triathlon, athletes swim 2.4 miles, bicycle 112 miles, and run 26 miles. Their total time include transition time from one activity to the next. Also given three below graphs that represent the participant:
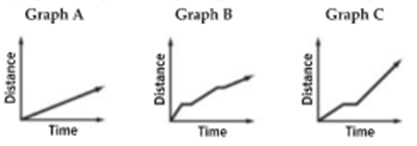
As there are given three events, there will be two transition times from one activity to another activity, so most suitable graph, representing this situation will have two line segments, parallel to x axis, representing no change in distance covered as the time increases.
Conclusion:
As based on above fact, graph B best represents the given situation, showing two line segments parallel to x axis for a short duration of time.
Chapter 1 Solutions
Algebra 1, Homework Practice Workbook (MERRILL ALGEBRA 1)
Additional Math Textbook Solutions
PREALGEBRA
College Algebra (7th Edition)
Linear Algebra and Its Applications (5th Edition)
College Algebra
College Algebra
Probability and Statistics for Engineers and Scientists


 Algebra and Trigonometry (6th Edition)AlgebraISBN:9780134463216Author:Robert F. BlitzerPublisher:PEARSON
 Contemporary Abstract AlgebraAlgebraISBN:9781305657960Author:Joseph GallianPublisher:Cengage Learning
 Linear Algebra: A Modern IntroductionAlgebraISBN:9781285463247Author:David PoolePublisher:Cengage Learning
 Algebra And Trigonometry (11th Edition)AlgebraISBN:9780135163078Author:Michael SullivanPublisher:PEARSON
 Introduction to Linear Algebra, Fifth EditionAlgebraISBN:9780980232776Author:Gilbert StrangPublisher:Wellesley-Cambridge Press
 College Algebra (Collegiate Math)AlgebraISBN:9780077836344Author:Julie Miller, Donna GerkenPublisher:McGraw-Hill Education