
Videos
B. Thomas Testing Labs
John Thomas, the owner of Thomas Testing, has for some time done contract work for insurance companies regarding drunk driving. To improve his research capabilities, he recently purchased the Rupple Driving Simulator. This device will allow a subject to take a “road test” and provide a score indicating the number of driving errors committed during the test drive. Higher scores indicate more driving errors. Driving errors would include not coming to a complete stop at a stop sign, not using turning signals, not exercising caution on wet or snowy pavement, and so on. During the road test, problems appear at random and not all problems appear in each road test. These are major advantages to the Rupple Driving Simulator because subjects do not gain any advantage by taking the test several times.
With the new driving simulator, Mr. Thomas would like to study in detail the problem of drunk driving. He begins by selecting a random sample of 25 drivers. He asks each of the selected individuals to take the test drive on the Rupple Driving Simulator. The number of errors for each driver is recorded. Next, he has each of the individuals in the group drink three 16-ounce cans of beer in a 60-minute period and return to the Rupple Driving Simulator for another test drive. The number of driving errors after drinking the beer is also shown. The research question is: Does alcohol impair the driver’s ability and, therefore, increase the number of driving errors?
Mr. Thomas believes the distribution of scores on the test drive does not follow a
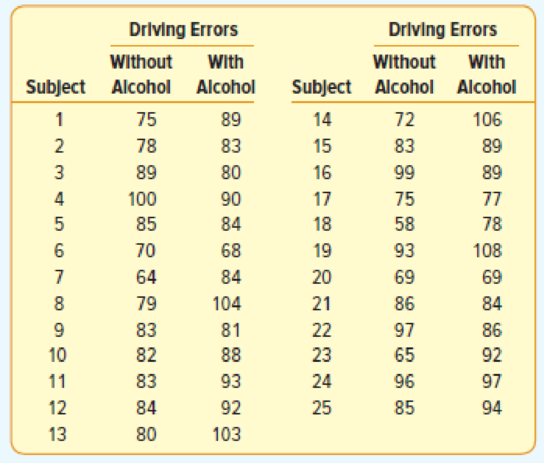
- a. Compare the results using these two procedures. Conduct an appropriate test of hypothesis to determine if alcohol is related to driving errors.
- b. Write a report that summarizes your findings.
Want to see the full answer?
Check out a sample textbook solution
Chapter 16 Solutions
Statistical Techniques in Business and Economics


- A common measure of flexibility is the sit-and-reach test, where a person sits on the floor with legs straight in front. The person then reaches as far forward as possible, and the distance reached past the feet is recorded. The histograms summarize the results of the sit-and-reach test for two groups, young adult men and middle-aged men. Negative distances represent a reach that is not as far as the feet. Young Adult Men 25T 20- 15 Frequency 10- 5+ 0- -20 -10 0 10 Distance (centimeters) 20 30 Middle-Aged Men 25 20- 15- Frequency 10+ 5 -20 -10 10 20 30 Distance (centimeters) (A) (B) (C) (D) Which of the following statements is the best description of the distributions of distances? The distribution for young adult men is approximately symmetric, and the distribution for middle-aged men is skewed to the right. The distribution for young adult men is approximately symmetric, and the distribution for middle-aged men is skewed to the left. The distribution for young adult men is skewed to…arrow_forwardYour math teacher Ms. Washington notices that students with calculators do better on her math tests than those without calculators. To test her hypothesis, she randomly chooses 20 students and tracks their progress. She then gives 10 of those students a calculator and after a period of times compares progress again. The calculator group showed an increase. Which fact would lead you to believe that the relationship between calculator and progress may be one of causation? Tim’s scores decreased with the calculator. Tom’s scores increased with the calculator. A control group was used and the subjects were chosen randomly. Tammy’s scores did not change with the calculator.arrow_forwardAn investigation of a number of automobile accidents revealed the following information. 18 accidents involved alcohol and excessive speed. 28 accidents involved alcohol. 14 accidents involved excessive speed but not alcohol. 18 accidents involved neither alcohol nor excessive speed. How many accidents were investigated?arrow_forward
- A paper investigated the driving behavior of teenagers by observing their vehicles as they left a high school parking lot and then again at a site approximately 1 2 mile from the school. Assume that it is reasonable to regard the teen drivers in this study as representative of the population of teen drivers. Amount by Which Speed Limit Was Exceeded MaleDriver FemaleDriver 1.2 -0.1 1.4 0.4 0.9 1.1 2.1 0.7 0.7 1.1 1.3 1.2 3 0.1 1.3 0.9 0.6 0.5 2.1 0.5 (a) Use a .01 level of significance for any hypothesis tests. Data consistent with summary quantities appearing in the paper are given in the table. The measurements represent the difference between the observed vehicle speed and the posted speed limit (in miles per hour) for a sample of male teenage drivers and a sample of female teenage drivers. (Use μmales − μfemales.Round your test statistic to two decimal places. Round your degrees of freedom down to the nearest whole number. Round your p-value to…arrow_forwardA 2009 study shpwed that handling money reduces the perception of pain. Two groups of participants were asked to participate in a manual dexterity study. Half of the participants were given a stack of blank pieces of paper to count and the other half were given money to count. After the counting task, the participants were asked to dip their hands in 122 degree Farenheit water and rate how uncomfortable it was . The following data shows ratings of pain similar to the results obtained in the study. Counting Money Counting Paper 7 9 8 11 10 13 6 10 8 11 5 9 7 15 12 14 5 10 A. based on the sample data, does the treatment, does the treatment have a significant effect? Test with a=.01. ( make sure you have ALL the steps involved in a hypothesis test). B. Calculate Cohens d to estimate the effect size. C. What a sentence describing the outcome of the hypothesis test and the measure of effect size as it would appear on a research report.arrow_forwardPlease complete the following summary table for the following scenario. Please be sure to round your answers correctly to two decimal places (else it is marked wrong). An educational psychologist is interested in the effect of reading on reasoning abilities. Ten students from grades six through eight are enrolled in a reading club that requires daily reading of books for thirty days. Student reasoning ability is tested using a logic quiz with twenty question. The number of correct answers was recorded for each student. The researcher administered a logic quiz before, during, and after the thirty day reading assignment. Means are included below. Did the reading regularly affect reasoning? Before; 10.70 During: 11.50 After: 14.00 Source Time Error Sum of Squares 59.00 18.00 df 2 27 Mean Squares 29.5 0.67 F 44.03arrow_forward
 Glencoe Algebra 1, Student Edition, 9780079039897...AlgebraISBN:9780079039897Author:CarterPublisher:McGraw Hill
 Holt Mcdougal Larson Pre-algebra: Student Edition...AlgebraISBN:9780547587776Author:HOLT MCDOUGALPublisher:HOLT MCDOUGAL
 Big Ideas Math A Bridge To Success Algebra 1: Stu...AlgebraISBN:9781680331141Author:HOUGHTON MIFFLIN HARCOURTPublisher:Houghton Mifflin Harcourt