
Videos
(Optimal Provision of Public Goods) Using at least two individual consumers, show how the market
the market demand curve is to be derived from individual demand curves for a private goods and for a public good and then introduce the market supply curve and show the optimal level of production.
Concept Introduction:
A demand curve is a graph that shows the change in quantity demanded of a good or service with respect to its price. With change in price the demand also change and it carries an inverse relationship with the price. Market demand refers to the demand of a good in a particular market that adds up to a sum of different individual demands.
Explanation of Solution
Individual demand curves adds up to make a market demand curve for a good. It is a broader term that defines demand of a particular good at a much larger scale.
a. For a private good: Private good refers to the good that needs to be purchased from the private individual and its consumption by one individual prevents it to be consumed from the other individuals.
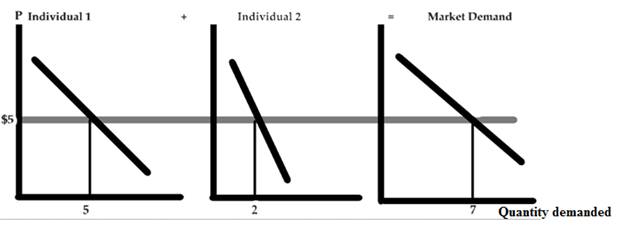
In the above figure there are three curves, where curve 1 is the individual demand curve for a good at price $5 and quantity 5 units. The second curve represents the individual demand curve for the same good at same price but the quantity is 2. The third curve is the market demand curve which is the summation of curve 1 of individual 1 and curve 2 of individual 2 at price $5 same as before. The market demand curve is the summation of curve 1 and curve 2 therefore the quantity for the same is 5 + 2 = 7 units.
b. For public good: A public good is a good which is provided to all the members of the society without profit, it is provided by the government, individual or an organization. The consumption of such good doesn’t affect the consumption for others.
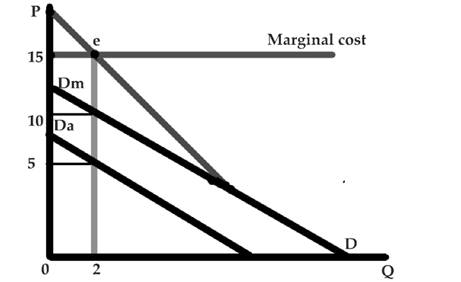
Public good once produced is available to all people and in identical amounts. Hence the demand for the public good is the vertical summation of each individuals demand. The marginal cost here equals the marginal benefits at e where the market demand curve and the marginal cost curve are at equilibrium. The red line on the graph represent the market demand curve and the blue line defines the marginal cost curve. Dm and Da are respectively the two individual demand curves which add up vertically with quantity being constant to make the market demand curve.
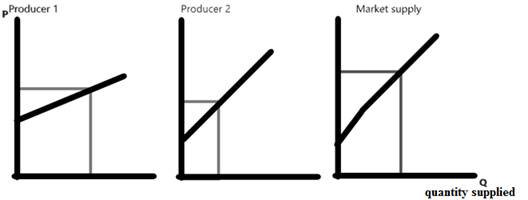
The market supply curve is an upward sloping curve which shows a positive relationship between the price and the quantity supplied. The summation of the individuals producers supply makes the market supply curve.
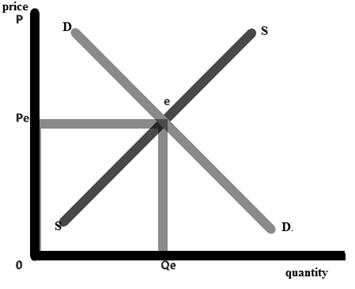
The optimal level of production is the point where the market demand is equal to that of the market supply and that level of intersection is called the market demand.
Want to see more full solutions like this?


- 6 Assume that you are a rational person and that you visit a grocery store to buy bananas. Use the marginal benefit and marginal cost (utils) principle, described in Unit 1, to explain how many bananas you will ultimately buy.arrow_forward1.Use the marginal analysis technique to determine the quantity of organic coconut oil that will maximize net benefits. Present results in table form and highlight the maximizinglevel. 2. Graphically illustrate letter B. Separate the graphs for TB – TC approach, MB = MC rule, and net benefit (maximum). The sequence of the graph: (1) TB – TC approach (topmost graph); (2) net benefit (middle graph); and (3) MB, MC, & MNB (last, 3rd graph). But be sure that the graphs are parallel in X-axis so as to be consistent in the results. (Label your graphs accordingly and appropriately.)arrow_forward1. What characteristic of public goods makes it very difficult for private firms to provide (or provide the correct amount of) the public good? What "problem" does this characteristic lead to that generally results in the need for the government to provide the public good? Explain this "problem." 2. List 5 distinct examples of public goods.arrow_forward
- 8. The interaction of individual choices Because a type of fish is on the verge of extinction, the government imposes rules that prohibit fishing in the publicly-owned spawning grounds. At first, owners of fishing boats complain about this restriction on where they can fish, but soon they notice that the number of adult fish swimming outside the protected area is much higher than it was before. With the restriction, each fishing boat ends up catching more fish than it did before the restriction was in place. Which of the following principles of economic interaction best describes this scenario? A-Markets usually lead to efficiency. B-When markets do not achieve efficiency, government intervention can improve overall welfare. C-Markets allocate goods effectively. D-There is a tradeoff between equality and efficiency. 9. Property rights and market failures Loggers are much____ likely to supply wood to the market if property rights are enforced.…arrow_forwardQuestion: Suppose the United States can produce cattle or corn with a given amount of resources. Below is a graph depicting the production possibility frontier for the United States and the marginal benefit and cost of a bushel of corn. Discuss the relationship between the marginal cost and marginal benefit of corn and the production of both corn and cattle. (a) Discuss the overallocation of resources, underallocation of resources, and optimal allocation of resources. (b) When operating at the optimal level of corn production, what is the optimal level of cattle production? Why is this the optimal amount (why not more or less cattle)?arrow_forwardRefer to the figure at right. If the farmer has 50 acres of land, the farmer is producing at point a, and an acre of land yields 400 bushels of beans or 800 bushels of wheat, how much land is devoted to the production of wheat? Part 2 A. 15 acres B. 12.5 acres C. 8.5 acres D. 10 acresarrow_forward
- -When should a private good be produced from an efficiency standpoint? a-When the sum of all of society’s marginal benefit exceeds the marginal cost b-When the marginal benefit from consumption exceeds the marginal cost c-When the marginal cost exceeds the marginal benefit from consumption d-When the marginal cost exceeds the sum of all of society’s marginal benefit -Suppose the government provides some amount of a public good, but it results in a reduction of private market’s production of the good by the same amount as the government produced. In this case, a-the warm glow effect caused an increase in the net amount of the public good. b-private provision is fully crowded out. c-private provision is partially crowded out. d-private provision is not crowded out.arrow_forward1. The additional benefit of producing one more roast beef sandwich at a local deli is $3. The additional cost of producing one more roast beef sandwich is $3. To improve allocative efficiency A. producers should produce one more roast beef sandwich because MB > MC. B. producers should produce one more roast beef sandwich because MB equals MC. C. producers should not produce one more roast beef sandwich because MB > MC. D. producers should not produce one more roast beef sandwich because MB equals MC.arrow_forward3. many areas of the country, aquifers (pools of underground water) serve as the primary water source. Water is extracted from the aquifer using wells and is replenished by rain and rivers. In many places the water is being extracted from the aquifers faster than it is being replenished, causing wells to run dry and farmers to have insufficient water for their crops. To address this, farmers in Kansas have all mutually agreed to reduce their usage of water. After reaching this agreement, each farmer must decide whether to follow the agreement. Assume that if everyone chooses a low level of production, all farmers will have enough water for the entire season. If a farmer chooses a high level of production, they will have more crops to sell but it will reduce the water available (and therefore the crop quality) for all farmers. Specifically, the farmers are faced with the decision shown in the images. a. If the game is played only one time, characterize each farmer’s best strategy.b.…arrow_forward
- 3. Voluntary contributions toward a public good Sean and Bob are considering contributing toward the creation of a water fountain. Each can choose whether to contribute $300 to the water fountain or to keep that $300 for a weekend getaway. Since a water fountain is a public good, both Sean and Bob will benefit from any contributions made by the other person. Specifically, every dollar that either one of them contributes will bring each of them $0.90 of benefit. For example, if both Sean and Bob choose to contribute, then a total of $600 would be contributed to the water fountain. So, Sean and Bob would each receive $540 of benefit from the water fountain, and their combined benefit would be $1,080. This is shown in the upper left cell of the first table. Since a weekend getaway is a private good, if Sean chooses to spend $300 on a weekend getaway, Sean would get $300 of benefit from the weekend getaway and Bob wouldn't receive any benefit from Sean's choice. If Sean still spends…arrow_forwardQuestion 26 Consider two ways to reduce pollution--establishment of taxes on the pollution or the sale of permits to polluters. Which of the following best describes the outcome? a Both methods can result in the same reduction of pollution, but the permits may achieve that goal with lower administrative costs. b Both methods can result in the same reduction of pollution, but the permits may achieve that goal with higher administrative costs. c The permits will allow more pollution, but both methods will have the same administrative costs. d Both methods can result in the same reduction of pollution and the same adminstrative costs.arrow_forwardDescribe one economic benefit, other than energy cost savings, that may result from increasing the amount of vegetation in cities.arrow_forward
 Essentials of Economics (MindTap Course List)EconomicsISBN:9781337091992Author:N. Gregory MankiwPublisher:Cengage Learning
 Brief Principles of Macroeconomics (MindTap Cours...EconomicsISBN:9781337091985Author:N. Gregory MankiwPublisher:Cengage Learning