
Concept explainers
Videos
Refer to Exercise 12.16. With α = .01, use the Wilcoxon signed-rank test to see if there was a significant loss in muck depth between the beginning and end of the study.
12.16 “Muck” is the rich, highly organic type of soil that serves as the primary growth medium for vegetation in the Florida Everglades. Because of the high concentration of organic material, muck can be destroyed over time by a variety of natural and human-made causes. Members of the Florida Game and Fresh Water Fish Commission staked out several plots in the Everglades. The depth of muck at each location was measured when each plot was marked and again 6 years later. The following table identifies a portion of the data (given in inches) obtained.
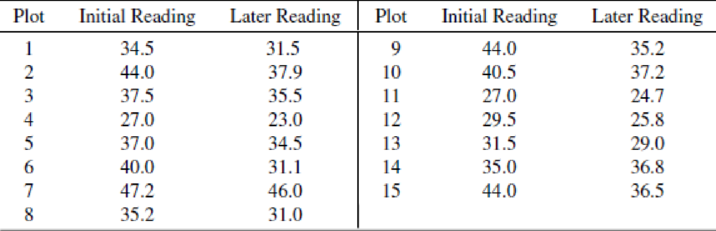
- a Test to see if there is sufficient evidence to indicate a decrease in average muck depth during the study period. Give bounds on the associated p-value. What would you conclude if you desired to implement an α = .01 level test? (Although you are free to take the necessary differences in any order that you prefer, the answer provided at the back of the book assumes that the differences were formed by taking later readings minus initial readings.)
- b Give a 95% confidence interval for the difference in mean muck depths at the end and beginning of the study. Interpret this interval. [See the remark following part (a).]
- c Give a 95% confidence interval for the initial mean muck depth in the portion of the Everglades in which the study was conducted.
- d Repeat the instructions of part (c) for later readings.
- e What assumptions are necessary to apply the techniques you used in answering parts (a) and (b)? Parts (c) and (d)?
Want to see the full answer?
Check out a sample textbook solution
Chapter 15 Solutions
Mathematical Statistics with Applications


- Air pollutants common in U.S. cities include fine particulate matter (PM) and ozone (O3). PM is measured as “inhalable” particles 10 micrometers in diameter or “fine inhalable” particles 2.5 micrometers in diameter. Suppose that studies show, for a particular region, that cities exceed PM2.5 standards 20% of the time and exceed ozone standards 10% of the time. Assume that PM2.5 and ozone measurements are statistically independent. A) Determine the probability that a city, selected at random, exceeds one of the standards. B) If a city exceeds the standards, what is the probability that it exceeds only the PM2.5 standard?arrow_forwardWrinkle recovery angle and tensile strength are the two most important characteristics for evaluating the performance of crosslinked cotton fabric. An increase in the degree of crosslinking, as determined by ester carboxyl band absorbance, improves the wrinkle resistance of the fabric (at the expense of reducing mechanical strength). The accompanying data on x = absorbance and y = wrinkle resistance angle was read from a graph in the paper "Predicting the Performance of Durable Press Finished Cotton Fabric with Infrared Spectroscopy".t x 0.115 0.126 0.183 0.246 0.282 0.344 0.355 0.452 0.491 0.554 0.651 y 334 342 355 363 365 372 381 400 392 412 420 Here is regression output from Minitab: Predictor Constant absorb S = 3.60498 Coef 321.878 156.711 SOURCE Regression Residual Error Total R-Sq= 98.5% DF SE Coef 2.483 6.464 1 9 10 SS 7639.0 117.0 7756..0 T 129.64 24.24 P 0.000 0.000. R-Sq (adj) 98.3% MS 7639.0 13.0 F 587.81 (a) Does the simple linear regression model appear to be appropriate?…arrow_forwardA baby dolphin is born into the ocean, which is a fairly cold environment. Water has a high heat conductivity, so the thermal regulation of a newborn dolphin is quite important. It has been known for a long time that baby dolphins' blubber is different in composition and quantity from the blubber of adults. Does this make the babies better protected from the cold compared to adults? One measure of the effectiveness of blubber is its "conductance". This value as calculated on 5 newborn dolphins and 10 adults dolphins (Dunkin et al. 2005). The newborn dolphins had an average conductance of 10.44, with a standard error of the mean equal to 0.58. The adult dolphins' conductance averaged 8.44, with the standard error of this estimate equal to 1.87. All measures are given in watts per square meter per degree Celcius. Calculate the standard deviation of conductance for the baby dolphin group. Round your answer two decimal places.arrow_forward
- A dentist wanted to determine if a relationship existed between childhood fluoride exposure and cavities. She took a sample of adults in her practice and counted how many cavities each person had in his or her permanent teeth. She also determined how many years of childhood each person was exposed to tap water with fluoride. The minimum value on this variable was 0 and the maximum was 18. Using the data below, an alpha of .05 and a two-tailed test, was there a significant relationship? Years of fluoride Number of cavities 0 10 18 1 2 7 12 3 3 4 10 5 M = 7.5s =6.98 M = 5.00s = 3.16arrow_forwardPlants emit gases that trigger the ripening of fruit, attract pollinators, and cue other physiological responses. A study examined factors that affect the emission of volatile compounds by a type of potato plant. The volatile compounds analyzed were hydrocarbons used by other plants and animals. Following are data on plant weight (x), in grams, and quantity of volatile compounds emitted (y), in hundreds of nanograms, for 11 potato plants. Use this information to complete parts (a) through (d). 58 85 57 65 52 67 62 80 76 52 68 y 8.5 22 10 22.5 12.5 11.5 7 13 16.5 , 21.5 11 (Exv - (Ex)(E»)/n) Ex - (Ex)*/ 2 a. Compute SST, SSR, and SSE, using the formulas SST= - ΣΥ- Σν)' /n. ssR = and SSE = SST – SSR. %3D SST = (Type an integer or decimal rounded to two decimal places as needed.) SSR = (Type an integer or decimal rounded to two decimal places as needed.) SSE = (Type an integer or decimal rounded to two decimal places as needed.) b. Compute the coefficient of determination, 2 %3D (Type an…arrow_forwarda) We conduct a regression of size on hhinc, owner, hhsize, hhsize2,and hhsize3. We do not include the constant. The regression output is reported in Table 3. Would you conclude that the home size increases with the household size? Interpret the sign and magnitude of the estimated coefficients of hhsize1, hhsize2, and hhsize3.arrow_forward
- Algal blooms can have negative effects on an ecosystem by dominating its phytoplankton communities. Gonyostomum semen is a nuisance alga infesting many parts of northern Europe. Could the overall biomass of G. semen be controlled by grazing zooplankton species? A research team examined the relationship between the net growth rate of G. semen and the number of Daphnia magna grazers introduced in test tubes. Net growth rate was computed by comparing the initial and final abundance of G. semen in the experiment, with a negative value indicative of a decrease in abundance. The study also examined the grazing effect of another species, Daphnia pulex, on the abundance of the nuisance alga G. semen in the lab. The table displays the findings Number of D. pulex grazers 0 1 2 3 4 5 6 Net growth rate of G. semen -0.7 -0.4 -0.6 -0.3 -0.5 -1.0 -0.2 Find the correlation, ?. Enter your answer rounded to three decimal places.arrow_forwardThe depth of wetting of a soil is the depth to which water content will increase owing to extemal factors. The article "Discussion of Method for Evaluation of Depth of Wetting in Residential Areas" (J. Nelson, K. Chao, and D. Overton, Journal of Geotechnical and Geoenvironmental Engineering, 2011:293-296) discusses the relationship between depth of wetting beneath a structure and the age of the structure. The article presents measurements of depth of wetting, in meters, and the ages, in years, of 21 houses, as shown in the following table. Age Depth 7.6 4 4.6 6.1 9.1 3 4.3 7.3 5.2 10.4 15.5 5.8 10.7 4 5.5 6.1 10.7 10.4 4.6 7.0 6.1 14 16.8 10 9.1 8.8 Compute the least-squares line for predicting depth of wetting (y) from age (x). b. Identify a point with an unusually large x-value. Compute the least-squares line that results from deletion of this point. Identify another point which can be classified as an outlier. Compute the least-squares line that results from deletion of the outlier,…arrow_forwardAlgal blooms can have negative effects on an ecosystem by dominating its phytoplankton communities. Gonyostomum semen is a nuisance alga infesting many parts of northern Europe. Could the overall biomass of G. semen be controlled by grazing zooplankton species? A research team examined the relationship between the net growth rate of G. semen and the number of Daphnia magna grazers introduced in test tubes. Net growth rate was computed by comparing the initial and final abundance of G. semen in the experiment, with a negative value indicative of a decrease in abundance. The table contains the findings. Number of D. magnagrazers 1 2 3 4 5 6 Net growth rate of G. semen -1.9 -2.5 -2.2 -3.9 -4.1 -4.3 Find the correlation, ?. Use decimal notation. (Enter your answer rounded to three decimal places.)arrow_forward
- The DENR has a new procedure to detect algal bloom in water being tested. This new procedure is important because, it could be used to detect three different contaminants-organic pollutants, volatile solvents, and chlorinated compounds. The department claims that it can detect high levels of organic pollutants with 99.95% accuracy, volatile solvents with 99.70% accuracy, and chlorinated compounds with 89.70% accuracy. If an algal bloom is not present, the test does not signal. Samples are prepared for the calibration of the test and 60% of them are contaminated with organic pollutants, 27% with volatile solvents, and 13% with traces of chlorinated compounds. A test sample is selected randomly. Denote as follows: S= signal, 0 = organic pollutants, V = volatile solvents, C = chlorinated compounds. If the test signals, what is the probability that chlorinated compounds are present? (Show complete solution in your answer sheet) O a. P(C|S) = 0.1184 O b. P(C|S) = 0.1386 O c. None among the…arrow_forward17.7 Butterfly wings. Researchers studied the morphological attributes of monarch butterflies (Danaus plexippus), a species that undertakes large seasonal migrations over North America. They measured the forewing weight (in milligrams, mg) of a sample of 92 monarch butterflies, all of which had been reared in captivity in identical conditions.° Figure 17.4 shows the output from the statistical software JMP. (The data are also available in the Large.Butterfly the data file if you wish to practice working with your own software.) Estimate with 95% confidence the mean forewing weight of monarch butterflies reared in captivity. Follow the four- step process as illustrated in Example 17.2. 4 STEP そMP FWweight 30 25 20 15 10 11 12 13 14 15 8 9 10 Summary Statistics Mean 11.795652 Std Dev 1.1759413 Std Err Mean 0.1226004 Upper 95% Mean Lower 95% Mean 1 FIGURE 17.4 Software output (JMP) for the forewing weight of monarch 12.039183 11.552122 92 N. butterflies. Countarrow_forward
 Linear Algebra: A Modern IntroductionAlgebraISBN:9781285463247Author:David PoolePublisher:Cengage Learning
 Calculus For The Life SciencesCalculusISBN:9780321964038Author:GREENWELL, Raymond N., RITCHEY, Nathan P., Lial, Margaret L.Publisher:Pearson Addison Wesley,
 Glencoe Algebra 1, Student Edition, 9780079039897...AlgebraISBN:9780079039897Author:CarterPublisher:McGraw Hill