
Videos
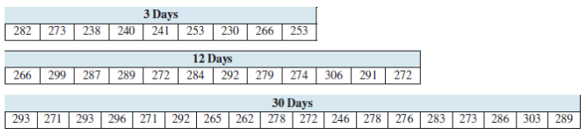
Microorganisms play a crucial role in wastewater treatment by transforming solid organic matter into carbon dioxide and water In a wastewater treatment system, the solids retention time is average amount of time that solid organic matter resides in the treatment tank. A study was performed at the Colorado School of Mines to determine the relationship between the solids retention time and the diversity of the microorganism population. It was thought, because microorganisms feed on the solid matter, that longer retention times would provide more opportunity for genetic mutations to occur, resulting in a greater diversity of microorganisms.
Following are counts of the numbers of species of microorganism for retention times of 3 days, 12 days, and 30 days.
Can you conclude at the
Want to see the full answer?
Check out a sample textbook solution
Chapter 15 Solutions
Elementary Statistics ( 3rd International Edition ) Isbn:9781260092561


- If your graphing calculator is capable of computing a least-squares sinusoidal regression model, use it to find a second model for the data. Graph this new equation along with your first model. How do they compare?arrow_forwardArsenic is a naturally occurring chemical that can enter groundwater through eroding granite or from a burned forest. A health organization recommends drinking water should contain no more than 10 parts per billion (ppb) of arsenic. A company produces filters to clean arsenic from private wells that could be affected by the groundwater. The company wants to investigate the effectiveness of a new filter compared to that of an older filter. They will test the filters on a field that is bordered on one side by a granite ledge and on the other side by a burned forest. The field is divided into 88 square plots of equal size, and a well to collect groundwater is drilled in the center of each plot. One filter will be used in each well. The following diagram shows the placement of the wells in the field. The company will use four of each type of filter to conduct the investigation. A randomized block design will be used. (a) Assuming there is a difference in the effectiveness of the two…arrow_forwardAssume we have data demonstrating a strong linear link between the amount of fertilizer applied to certain plants and their yield. Which is the independent variable in this research question?arrow_forward
- Cellulon, a manufacturer of home insulation, wants to develop guidelines for builders and consumers on how the thickness of the insulation in the attic of a home and the outdoor temperature affect natural gas consumption. In the laboratory, it varied the insulation thickness and temperature. A few of the findings are: Monthly Natural Gas Consumption (cubic feet), Thickness of Outdoor Insulation Temperature (2F), (inches), X1 X2 y 30.3 40 26.9 12 40 22.1 8 49 On the basis of the sample results, the regression equation is: y = 62.65 – 1.86x, – 0.52x2 a. How much natural gas can homeowners expect to use per month if they install 6 inches of insulation and the outdoor temperature is 40 degrees F? (Round your answer to 2 decimal places.) Natural gas cubic feet b. What effect would installing 7 inches of insulation instead of 6 have on the monthly natural gas consumption (assuming the outdoor temperature remains at 40 degrees F)? (Round your answers to 2 decimal places.) of cubic feet of…arrow_forwardCellulon, a manufacturer of home insulation, wants to develop guidelines for builders and consumers on how the thickness of the insulation in the attic of a home and the outdoor temperature affect natural gas consumption. In the laboratory, it varied the insulation thickness and temperature. A few of the findings are: Monthly Natural Gas Consumption (cubic feet), Thickness of Insulation (inches), Outdoor Temperature (ºF), y x1 x2 30.3 6.0 50.0 25.4 12 40 31.8 8 49 On the basis of the sample results, the regression equation is: yˆy^ = 167.66 − 3.61x1 − 2.31x2 How much natural gas can homeowners expect to use per month if they install 6 inches of insulation and the outdoor temperature is 50 degrees F? (Round your answer to 2 decimal places.) What effect would installing 7 inches of insulation instead of 6 have on the monthly natural gas consumption (assuming the outdoor temperature remains at 50 degrees F)? (Round your…arrow_forwardCellulon, a manufacturer of home insulation, wants to develop guidelines for builders and consumers on how the thickness of the insulation in the attic of a home and the outdoor temperature affect natural gas consumption. In the laboratory, it varied the insulation thickness and temperature. A few of the findings are: Monthly Natural Gas Consumption (cubic feet), Thickness of Insulation (inches), Outdoor Temperature (ºF), y x1 x2 30.3 6.0 32.0 25.2 12 40 30.5 8 49 On the basis of the sample results, the regression equation is: yˆ y^ = 57.25 − 1.07x1 − 0.64x2arrow_forward
- DDT (dichlorodiphenyltrichloroethane) was used extensively from 1940 to 1970 as an insecticide. It still sees limited use for control of disease. But DDT was found to be harmful to plants and animals, including humans, and its effects were found to be lasting. The amount of time that DDT remains in the environment depends on many factors, but the following table shows what can be expected of 200 kilograms of DDT that has seeped into the soil. t = time in yearssince application D = DDT remaining,kilograms 0 200.00 1 190.00 2 180.50 3 171.48 (a) Show that the data are exponential. The ratio from year 0 to year 1 is ______ , from year 1 to year 2 is ____ , and from year 2 to year 3 is_____ (rounded to two decimal places). Because these successive ratios are all , a) different b)the same , the data are exponential.arrow_forwardIs at least one of the two variables (weight and horsepower) significant in the model?arrow_forwardWrinkle recovery angle and tensile strength are the two most important characteristics for evaluating the performance of crosslinked cotton fabric. An increase in the degree of crosslinking, as determined by ester carboxyl band absorbance, improves the wrinkle resistance of the fabric (at the expense of reducing mechanical strength). The accompanying data on x = absorbance and y = wrinkle resistance angle was read from a graph in the paper "Predicting the Performance of Durable Press Finished Cotton Fabric with Infrared Spectroscopy".† x 0.115 0.126 0.183 0.246 0.282 0.344 0.355 0.452 0.491 0.554 0.651 y 334 342 355 363 365 372 381 392 400 412 420 Here is regression output from Minitab: Predictor Constant absorb S = 3.60498 Coef 321.878 156.711 SOURCE Regression Residual Error Total SE Coef 2.483 6.464 R-Sq = 98.5% DF 1 9 10 SS 7639.0 117.0 7756.0 T 129.64 24.24 0.000 0.000 R-Sq (adj) = 98.3% MS 7639.0 13.0 F P 587.81 (a) Does the simple linear regression model appear to be…arrow_forward
- Wrinkle recovery angle and tensile strength are the two most important characteristics for evaluating the performance of crosslinked cotton fabric. An increase in the degree of crosslinking, as determined by ester carboxyl band absorbance, improves the wrinkle resistance of the fabric (at the expense of reducing mechanical strength). The accompanying data on x = absorbance and y = wrinkle resistance angle was read from a graph in the paper "Predicting the Performance of Durable Press Finished Cotton Fabric with Infrared Spectroscopy".t 半 0.115 0.126 0.183 0.246 0.282 0.344 0.355 0.452 0.491 0.554 0.651 334 342 355 363 365 372 381 392 400 412 420 Here is regression output from Minitab: Predictor Coef SE Coef P Constant 321.878 2.483 129.64 0.000 absorb 156.711 6.464 24.24 0.000 S = 3.60498 R-Sq = 98.5% R-Są (adj) - 98.3% SOURCE DF MS F P Regression 1 7639.0 7639.0 587.81 0.000 Residual Error 9 117.0 13.0 Total 10 7756.0 (a) Does the simple linear regression model appear to be…arrow_forwardA specimen of connective tissue (collagen) can be obtained from a beef steak. The temperature at which the collagen shrinks can be determined. A tender piece of meat tends to have a low collagen shrinkage temperature. So, the lower shrinkage temperature, the more tender the meat.It is believed that electrical stimulation of a beef carcass could improve the tenderness of the meat. In one study of this effect, beef carcasses were split in half; one side (half) was subjected to a brief electrical current and the other side was an untreated control. For each side, a steak was cut and tested in various ways for tenderness. In one test, the experimenter obtained a specimen of the connective collagen tissue from the steak and determined the temperature at which the tissue would shrink. The experimenter wishes to prove that electrical stimulation tends to improve the tenderness of the meat. The raw data are found in the table below. Let ? = 0.01. Table 1: Collagen Shrinkage Temperature…arrow_forwardCell Phone Radiation Listed below are the measured radiation absorption rates (in W/kg) corresponding to these cell phones: iPhone 5S, BlackBerry Z30, Sanyo Vero, Optimus V, Droid Razr, Nokia N97, Samsung Vibrant, Sony Z750a, Kyocera Kona, LG G2, and Virgin Mobile Supreme. The data are from the Federal Communications Commission.arrow_forward
 Trigonometry (MindTap Course List)TrigonometryISBN:9781305652224Author:Charles P. McKeague, Mark D. TurnerPublisher:Cengage Learning
 Mathematics For Machine TechnologyAdvanced MathISBN:9781337798310Author:Peterson, John.Publisher:Cengage Learning,