
APPLIED STAT.IN BUS.+ECONOMICS
6th Edition
ISBN: 9781259957598
Author: DOANE
Publisher: RENT MCG
expand_more
expand_more
format_list_bulleted
Videos
Textbook Question
Chapter 14, Problem 26CE
(a) Make a line chart and fit an m-period moving average to the exchange rate data shown below with m = 2, 3, 4, and 5 periods. For each method, state the last MA value. (b) Which value of m do you prefer? Why? (c) Is a moving average appropriate for this kind of data?
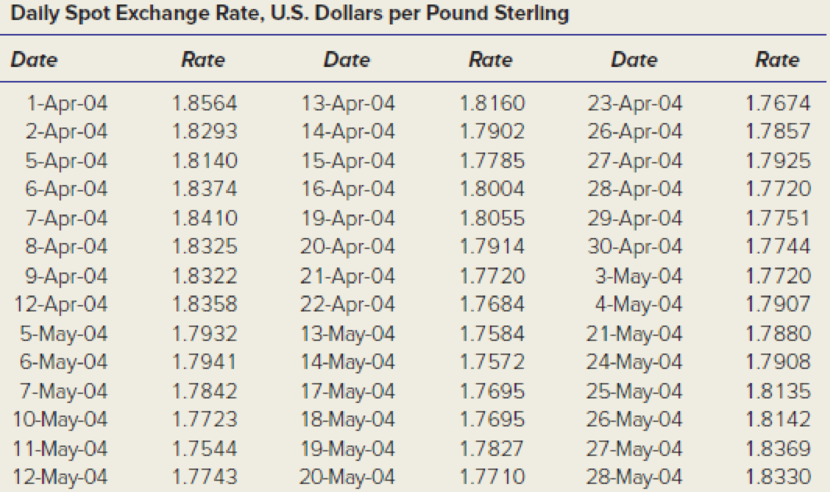
Source: Federal Reserve Board of Governors.
Expert Solution & Answer
Want to see the full answer?
Check out a sample textbook solution
Students have asked these similar questions
John Kittle, an independent insurance agent, uses a five-year moving average to forecast the number of claims made in a single year for one of the large insurance companies he sells for. He has just discovered that a clerk in his employ incorrectly entered the number of claims made four years ago as 1,400 when it should have been 1,200.a. What adjustment should Mr. Kittle make in next year’s forecast to take into account the corrected value of the number of claims four years ago?b. Suppose that Mr. Kittle used simple exponential smoothing with a = .2instead of moving averages to determine his forecast. What adjustment is now required in next year’s forecast? (Note that you do not need to know the value of the forecast for next year in order to solve this problem.)
The following data represent the inventory figures for 55-gallon fish tanks at an aquarium.
*Chart Attached*
(A): How many fish tanks did the aquarium have available for sale?
__________________fish tanks
(B): Calculate the total cost (in $) of the tanks available for sale.
$____________
(C): If physical inventory on December 31 showed 88 tanks on hand, calculate their dollar value by using FIFO.
$____________
The following table represents the MPY closing sock price over a period of 9 trading days. In the image. What is the 2nd 6-day simple moving average? Round your answer to nearest penny.
Chapter 14 Solutions
APPLIED STAT.IN BUS.+ECONOMICS
Ch. 14.2 - (a) Make an Excel graph of the data on the number...Ch. 14.2 - Prob. 3SECh. 14.2 - Prob. 4SECh. 14.2 - Prob. 5SECh. 14.4 - (a) Make an Excel line graph of the exchange rate...Ch. 14.5 - (a) Make an Excel line graph of the following bond...Ch. 14 - Explain the difference between (a) stocks and...Ch. 14 - (a) What is periodicity? (b) Give original...Ch. 14 - (a) What are the distinguishing features of each...Ch. 14 - Name four criteria for assessing a trend forecast.
Ch. 14 - Name two advantages and two disadvantages of each...Ch. 14 - When would the exponential trend model be...Ch. 14 - Explain how to obtain the compound percent growth...Ch. 14 - (a) When might a quadratic model be useful? (b)...Ch. 14 - Name five measures of fit for a trend, and state...Ch. 14 - Prob. 10CRCh. 14 - Prob. 11CRCh. 14 - Prob. 12CRCh. 14 - (a) Why is seasonality irrelevant for annual data?...Ch. 14 - Prob. 14CRCh. 14 - (a) Explain how seasonal binaries can be used to...Ch. 14 - What is the purpose of index numbers?Ch. 14 - (a) Make a line chart for JetBlues revenue. (b)...Ch. 14 - (a) Plot both Swiss watch time series on the same...Ch. 14 - (a) Make a line graph of the U.S. civilian labor...Ch. 14 - (a) Plot the voter participation rate. (b)...Ch. 14 - For each of the following fitted trends, make a...Ch. 14 - (a) Make a line graph of consumer credit...Ch. 14 - (a) Plot the data on U.S. general aviation...Ch. 14 - Prob. 17CECh. 14 - (a) Plot either receipts and outlays or federal...Ch. 14 - Prob. 19CECh. 14 - (a) Plot the data on leisure and hospitality...Ch. 14 - Prob. 21CECh. 14 - Prob. 22CECh. 14 - (a) Plot the data on skier/snowboard visits. (b)...Ch. 14 - Prob. 24CECh. 14 - (a) Plot U.S. petroleum imports on a graph. (b)...Ch. 14 - (a) Make a line chart and fit an m-period moving...Ch. 14 - Refer to exercise 14.26. (a) Plot the dollar/pound...Ch. 14 - (a) Plot the data on natural gas bills. (b) Can...Ch. 14 - (a) Plot the data on air travel delays. (b) Can...Ch. 14 - (a) Plot the data on airplane shipments. (b) Can...Ch. 14 - (a) Plot the data on revolving credit (credit...Ch. 14 - The following seasonal regression was fitted with...Ch. 14 - The following seasonal regression was fitted with...
Knowledge Booster


Learn more about
Need a deep-dive on the concept behind this application? Look no further. Learn more about this topic, statistics and related others by exploring similar questions and additional content below.Similar questions
- Find the mean hourly cost when the cell phone described above is used for 240 minutes.arrow_forwardTable 6 shows the year and the number ofpeople unemployed in a particular city for several years. Determine whether the trend appears linear. If so, and assuming the trend continues, in what year will the number of unemployed reach 5 people?arrow_forwardThe rent for tenants in a building in 1940 was $30 per month. The landlord changes the rent based on the CPI-U. Use the CPI-U chart below to calculate the current rent in 2019. Round to the nearest dollar. Year CPI-U 1940 14.0 1949 23.8 1983 99.6 2000 172.2 2005 195.3 2009 214.5 2014 236.0 2017 245.1 2019 255.7 2020 258.8arrow_forward
- vt 14. Calculate trend values by the method of Least Square from the data given below and estimate the sales for 2007. Year 2000 2001 2002 2003 2004 Sales of GA. (Rs. lakhs) 70 74 80 86 90 上arrow_forwardLimpopo company has recorded quarterly maize sales and seasonal ratios from 2015 to 2017 financial year. Table 1 shows quarterly maize production sales with their seasonal ratios (SR). Table 1: Seasonal ratios for maize production sales. Year 2015 2016 Quarter Sales SR Q₁, Q₂, Q3, Q Q₁ ₂ 8, 12, 12, 10 Q₂, Q3, 10, 15, 14, 10 111.63, 87.87 83.33,122.45, 115.42, 84.18 Q4 Use Table 1 to calculate: a) the median seasonal indices (S) and their totals (S). b) the adjusted factor. c) the adjusted seasonal indices (S) and their totals (S.). Q₁ 9 Q₂ 14 2017 " Q3, Q₁ 14, 12 76.60 ,116.67, 113.09, 94.12arrow_forwardConsider the price of three items for years 2017 and 2019.SUGAR(KG) CALCULATOR DEODORANT 20072019Price Quantity Price Quantity14.00 60.00 800 200 18.00 85.00 900 50025.00 300 40.00 600 3.1 The using 2015 as base year calculate:3.1.1 The Laspeyres price and quantity indices.3.1.2 The Paasche price and quantity indices.(8)(8) 3.2 Interpret the Paasche indices calculated in question 3.1.2 above. Note:- Do not provide handwritten solution. Maintain accuracy and quality in your answer. Take care of plagiarism. Answer completely. You will get up vote for sure.arrow_forward
arrow_back_ios
arrow_forward_ios
Recommended textbooks for you
 College AlgebraAlgebraISBN:9781305115545Author:James Stewart, Lothar Redlin, Saleem WatsonPublisher:Cengage Learning
 College Algebra (MindTap Course List)AlgebraISBN:9781305652231Author:R. David Gustafson, Jeff HughesPublisher:Cengage Learning
 Algebra: Structure And Method, Book 1AlgebraISBN:9780395977224Author:Richard G. Brown, Mary P. Dolciani, Robert H. Sorgenfrey, William L. ColePublisher:McDougal Littell
 Holt Mcdougal Larson Pre-algebra: Student Edition...AlgebraISBN:9780547587776Author:HOLT MCDOUGALPublisher:HOLT MCDOUGAL
College Algebra
Algebra
ISBN:9781305115545
Author:James Stewart, Lothar Redlin, Saleem Watson
Publisher:Cengage Learning
College Algebra (MindTap Course List)
Algebra
ISBN:9781305652231
Author:R. David Gustafson, Jeff Hughes
Publisher:Cengage Learning
Algebra: Structure And Method, Book 1
Algebra
ISBN:9780395977224
Author:Richard G. Brown, Mary P. Dolciani, Robert H. Sorgenfrey, William L. Cole
Publisher:McDougal Littell
Holt Mcdougal Larson Pre-algebra: Student Edition...
Algebra
ISBN:9780547587776
Author:HOLT MCDOUGAL
Publisher:HOLT MCDOUGAL
Time Series Analysis Theory & Uni-variate Forecasting Techniques; Author: Analytics University;https://www.youtube.com/watch?v=_X5q9FYLGxM;License: Standard YouTube License, CC-BY
Operations management 101: Time-series, forecasting introduction; Author: Brandoz Foltz;https://www.youtube.com/watch?v=EaqZP36ool8;License: Standard YouTube License, CC-BY