
APPLIED STAT.IN BUS.+ECONOMICS
6th Edition
ISBN: 9781259957598
Author: DOANE
Publisher: RENT MCG
expand_more
expand_more
format_list_bulleted
Videos
Textbook Question
Chapter 14, Problem 11CE
(a) Plot both Swiss watch time series on the same graph. (b) Describe the trend (if any) and discuss possible causes. (c) Fit an exponential trend to each time series. (d) Interpret each fitted trend carefully. What conclusion do you draw? (e) Make forecasts for the next three years, using the linear trend model. (f) Why might 2009 have been unusual? Explain.  Swiss
Swiss
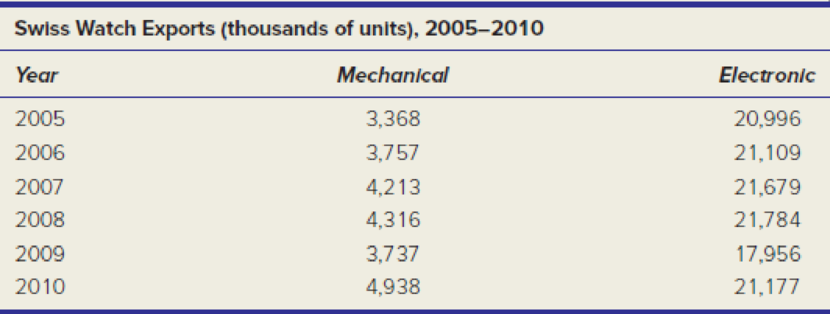
Source: Federation de L’ Industrie Horlogere Suisse, Swiss Watch Exports, www.fhs.ch/en/statistics.php.
Expert Solution & Answer
Want to see the full answer?
Check out a sample textbook solution
Chapter 14 Solutions
APPLIED STAT.IN BUS.+ECONOMICS
Ch. 14.2 - (a) Make an Excel graph of the data on the number...Ch. 14.2 - Prob. 3SECh. 14.2 - Prob. 4SECh. 14.2 - Prob. 5SECh. 14.4 - (a) Make an Excel line graph of the exchange rate...Ch. 14.5 - (a) Make an Excel line graph of the following bond...Ch. 14 - Explain the difference between (a) stocks and...Ch. 14 - (a) What is periodicity? (b) Give original...Ch. 14 - (a) What are the distinguishing features of each...Ch. 14 - Name four criteria for assessing a trend forecast.
Ch. 14 - Name two advantages and two disadvantages of each...Ch. 14 - When would the exponential trend model be...Ch. 14 - Explain how to obtain the compound percent growth...Ch. 14 - (a) When might a quadratic model be useful? (b)...Ch. 14 - Name five measures of fit for a trend, and state...Ch. 14 - Prob. 10CRCh. 14 - Prob. 11CRCh. 14 - Prob. 12CRCh. 14 - (a) Why is seasonality irrelevant for annual data?...Ch. 14 - Prob. 14CRCh. 14 - (a) Explain how seasonal binaries can be used to...Ch. 14 - What is the purpose of index numbers?Ch. 14 - (a) Make a line chart for JetBlues revenue. (b)...Ch. 14 - (a) Plot both Swiss watch time series on the same...Ch. 14 - (a) Make a line graph of the U.S. civilian labor...Ch. 14 - (a) Plot the voter participation rate. (b)...Ch. 14 - For each of the following fitted trends, make a...Ch. 14 - (a) Make a line graph of consumer credit...Ch. 14 - (a) Plot the data on U.S. general aviation...Ch. 14 - Prob. 17CECh. 14 - (a) Plot either receipts and outlays or federal...Ch. 14 - Prob. 19CECh. 14 - (a) Plot the data on leisure and hospitality...Ch. 14 - Prob. 21CECh. 14 - Prob. 22CECh. 14 - (a) Plot the data on skier/snowboard visits. (b)...Ch. 14 - Prob. 24CECh. 14 - (a) Plot U.S. petroleum imports on a graph. (b)...Ch. 14 - (a) Make a line chart and fit an m-period moving...Ch. 14 - Refer to exercise 14.26. (a) Plot the dollar/pound...Ch. 14 - (a) Plot the data on natural gas bills. (b) Can...Ch. 14 - (a) Plot the data on air travel delays. (b) Can...Ch. 14 - (a) Plot the data on airplane shipments. (b) Can...Ch. 14 - (a) Plot the data on revolving credit (credit...Ch. 14 - The following seasonal regression was fitted with...Ch. 14 - The following seasonal regression was fitted with...
Knowledge Booster


Learn more about
Need a deep-dive on the concept behind this application? Look no further. Learn more about this topic, statistics and related others by exploring similar questions and additional content below.Similar questions
- Table 6 shows the year and the number ofpeople unemployed in a particular city for several years. Determine whether the trend appears linear. If so, and assuming the trend continues, in what year will the number of unemployed reach 5 people?arrow_forwardUse this data for the exercises that follow: In 2013, there were roughly 317 million citizens in the United States, and about 40 million were elderly (aged 65 and over).[34] 60. It is predicted that by 2030, one in five U.S. citizens will be elderly. How much greater will the chances of meeting an elderly person be at that time? What policy changes do you foresee if these statistics hold true?arrow_forward
Recommended textbooks for you

 Glencoe Algebra 1, Student Edition, 9780079039897...AlgebraISBN:9780079039897Author:CarterPublisher:McGraw Hill
 Big Ideas Math A Bridge To Success Algebra 1: Stu...AlgebraISBN:9781680331141Author:HOUGHTON MIFFLIN HARCOURTPublisher:Houghton Mifflin Harcourt
 Calculus For The Life SciencesCalculusISBN:9780321964038Author:GREENWELL, Raymond N., RITCHEY, Nathan P., Lial, Margaret L.Publisher:Pearson Addison Wesley,
 Trigonometry (MindTap Course List)TrigonometryISBN:9781305652224Author:Charles P. McKeague, Mark D. TurnerPublisher:Cengage Learning
 Holt Mcdougal Larson Pre-algebra: Student Edition...AlgebraISBN:9780547587776Author:HOLT MCDOUGALPublisher:HOLT MCDOUGAL
Glencoe Algebra 1, Student Edition, 9780079039897...
Algebra
ISBN:9780079039897
Author:Carter
Publisher:McGraw Hill
Big Ideas Math A Bridge To Success Algebra 1: Stu...
Algebra
ISBN:9781680331141
Author:HOUGHTON MIFFLIN HARCOURT
Publisher:Houghton Mifflin Harcourt
Calculus For The Life Sciences
Calculus
ISBN:9780321964038
Author:GREENWELL, Raymond N., RITCHEY, Nathan P., Lial, Margaret L.
Publisher:Pearson Addison Wesley,
Trigonometry (MindTap Course List)
Trigonometry
ISBN:9781305652224
Author:Charles P. McKeague, Mark D. Turner
Publisher:Cengage Learning
Holt Mcdougal Larson Pre-algebra: Student Edition...
Algebra
ISBN:9780547587776
Author:HOLT MCDOUGAL
Publisher:HOLT MCDOUGAL
Time Series Analysis Theory & Uni-variate Forecasting Techniques; Author: Analytics University;https://www.youtube.com/watch?v=_X5q9FYLGxM;License: Standard YouTube License, CC-BY
Operations management 101: Time-series, forecasting introduction; Author: Brandoz Foltz;https://www.youtube.com/watch?v=EaqZP36ool8;License: Standard YouTube License, CC-BY