
Videos
a.
Check whether there is a positive linear relationship between the minimum and maximum width of an object.
a.
Answer to Problem 40E
There is convincing evidence that there is a positive linear relationship between the minimum and maximum width of an object.
Explanation of Solution
Calculation:
The given data provide the dimensions of 27 representative food products.
Here,
Null hypothesis:
That is, there is no linear relationship between the minimum and maximum width of an object.
Alternative hypothesis:
That is, there is a positive linear relationship between the minimum and maximum width of an object.
Here, the significance level is
Test Statistic:
The formula for test statistic is as follows:
In the formula, b denotes the estimated slope,
A standardized residual plot is shown below:
Standardized residual values and standardized residual plot:
Software procedure:
Step-by-step procedure to compute standardized residuals and its plot using MINITAB software:
- Select Stat > Regression > Regression > Fit Regression Model.
- In Response, enter the column of Maximum width.
- In Continuous Predictors, enter the columns of Minimum width.
- In Graphs, select Standardized under Residuals for Plots.
- In Results, select for all observations under Fits and diagnostics.
- In Residuals versus the variables, select Minimum width.
- Click OK.
Output obtained MINTAB software is given below:
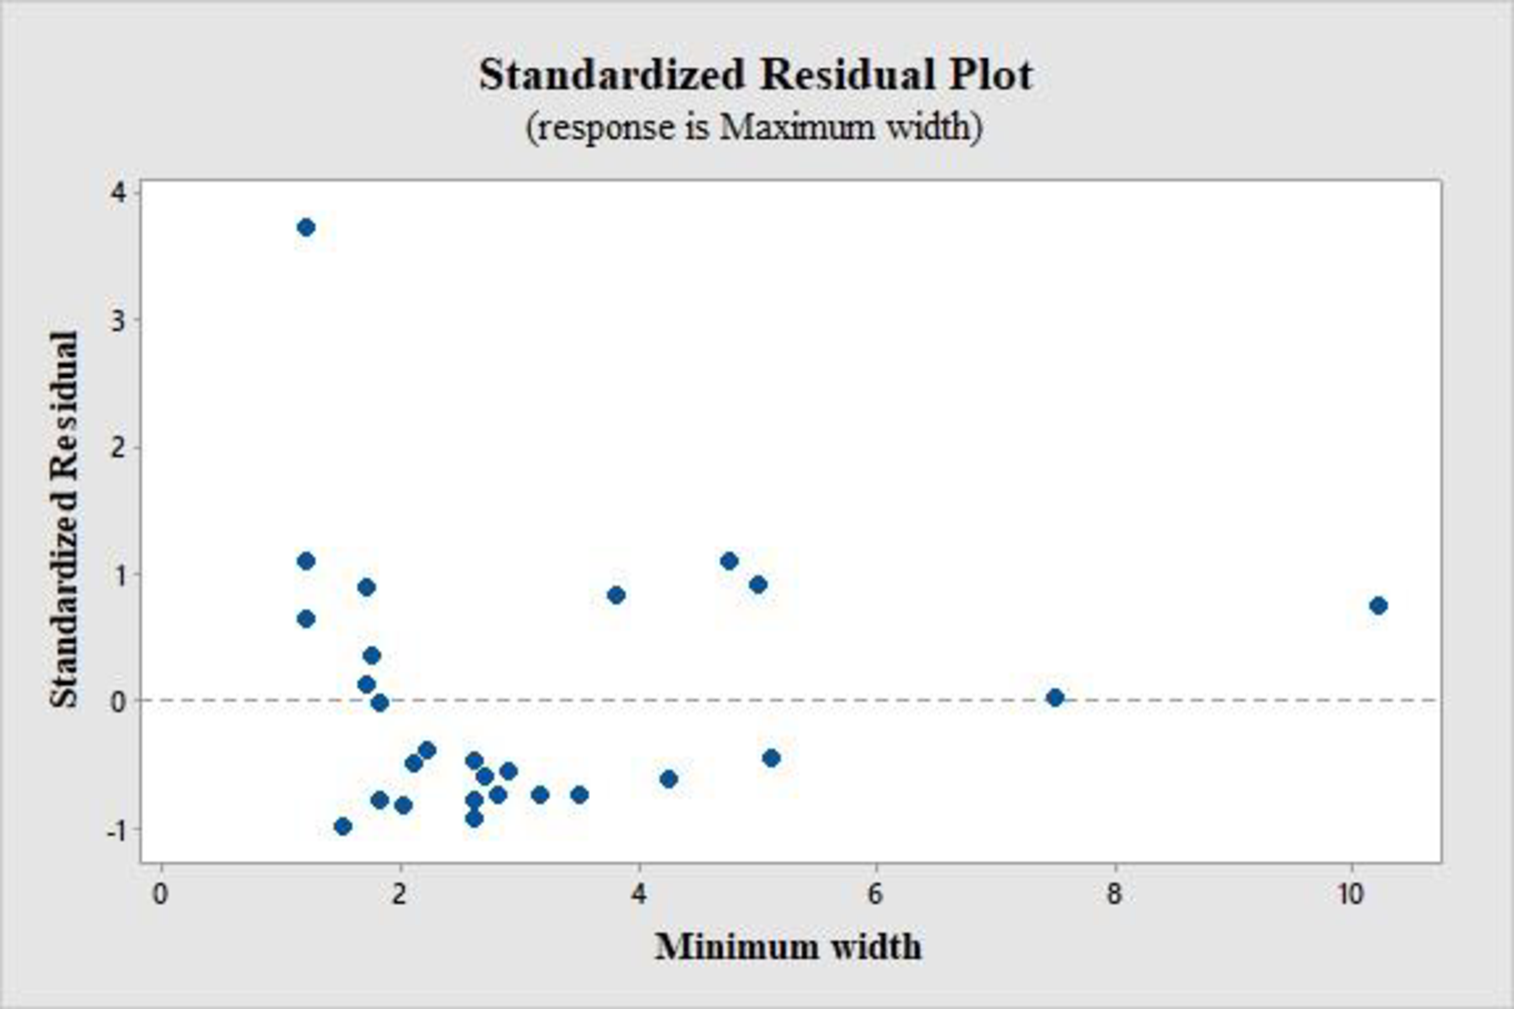
From the standardized residual plot, it is observed that one point lies outside the horizontal band of 3 units from the central line of 0. The standardized residual for this outlier is 3.72, that is, for product 25.
Assumption:
Here, the assumption made is that, the simple linear regression model is appropriate for the data, even though there is one extreme standardized residual.
Test Statistic:
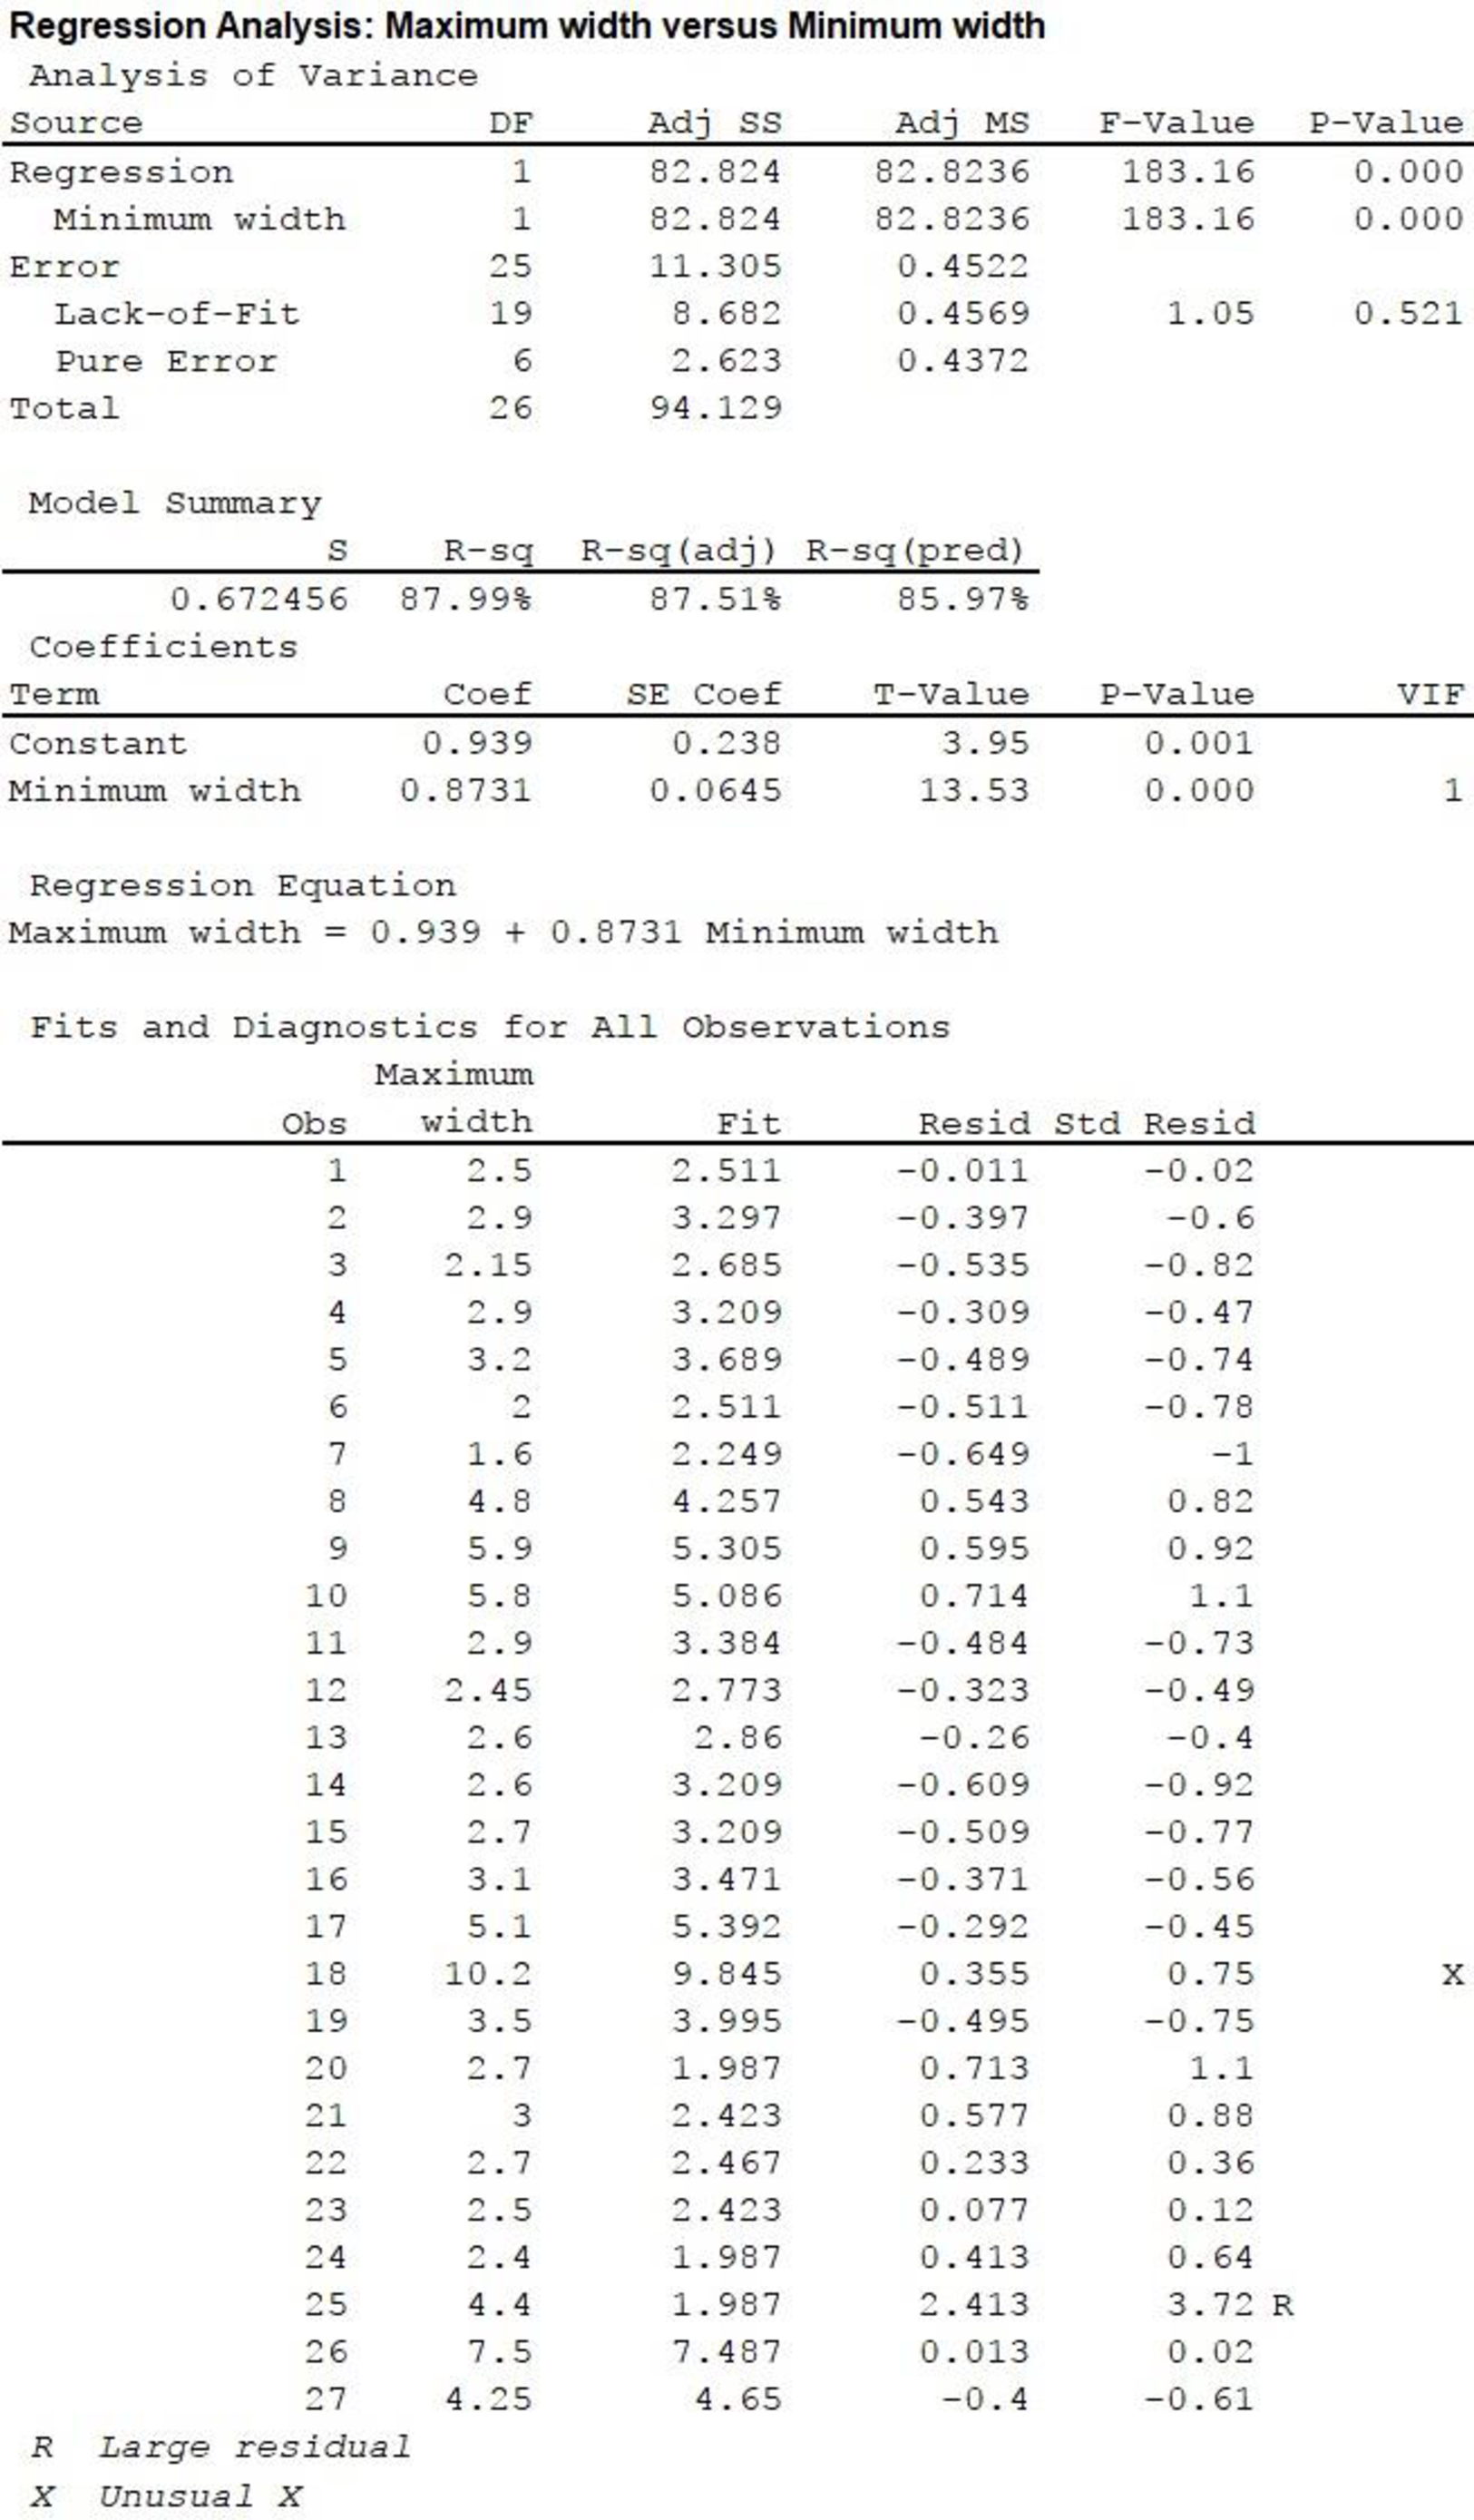
In the MINITAB output, the test statistic value is displayed in the column “T-value” corresponding to “Minimum width”, in the section “Coefficients”. The value is 13.53.
P-value:
From the above output, the corresponding P-value is 0.
Rejection rule:
If
Conclusion:
The P-value is 0 and the level of significance is 0.05.
The P-value is less than the level of significance.
That is,
Therefore, reject the null hypothesis.
Thus, there is convincing evidence that there is a positive linear relationship between the minimum and maximum width of an object.
b.
Compute and interpret
b.
Answer to Problem 40E
Explanation of Solution
Calculation:
From the MINITAB output in Part (a), it is clear that
On an average, there is 67.246% deviation of the maximum width in the sample from the value predicted by least-squares regression.
c.
Find the 95% confidence interval for the mean maximum width of products for the minimum width of 6 cm.
c.
Answer to Problem 40E
The 95% confidence interval for the mean maximum width of products for the minimum width of 6 cm is (5.708, 6.647).
Explanation of Solution
Calculation:
The confidence interval for
From the MINITAB output in Part (a), the estimated linear regression line is
Point estimate:
The point estimate is calculated as follows:
Estimated standard deviation:
For the given x values, the summation values are given in the following table:
| Minimum width (X) | |
| 1.8 | 3.24 |
| 2.7 | 7.29 |
| 2 | 4 |
| 2.6 | 6.76 |
| 3.15 | 9.9225 |
| 1.8 | 3.24 |
| 1.5 | 2.25 |
| 3.8 | 14.44 |
| 5 | 25 |
| 4.75 | 22.5625 |
| 2.8 | 7.84 |
| 2.1 | 4.41 |
| 2.2 | 4.84 |
| 2.6 | 6.76 |
| 2.6 | 6.76 |
| 2.9 | 8.41 |
| 5.1 | 26.01 |
| 10.2 | 104.04 |
| 3.5 | 12.25 |
| 1.2 | 1.44 |
| 1.7 | 2.89 |
| 1.75 | 3.0625 |
| 1.7 | 2.89 |
| 1.2 | 1.44 |
| 1.2 | 1.44 |
| 7.5 | 56.25 |
| 4.25 | 18.0625 |
The value of
Substitute
Formula for degrees of freedom:
The formula for degrees of freedom is as follows:
The number of data value given is 27, that is
Critical value:
From the Appendix: Table of the t-critical values:
- Locate the value 25 in the degrees of freedom (df) column.
- Locate the 0.95 in the row of central area captured.
- The intersecting value that corresponds to df 25 with the confidence level 0.95 is 2.060.
Thus, the critical value for
Substitute
Therefore, one can be 95% confident that the mean maximum width of products with the minimum width of 6 cm will be between 5.708 cm and 6.647 cm.
d.
Find the 95% prediction interval for the mean maximum width of products with the minimum width of 6 cm.
d.
Answer to Problem 40E
The 95% prediction interval for the mean maximum width of products with the minimum width of 6 cm is (4.716, 7.640).
Explanation of Solution
Calculation:
The confidence interval for
The estimated standard deviation of the amount by which a single y observation deviates from the value predicted by an estimated regression line is
Substitute
From Part (c), the critical value for
Substitute
Therefore, the 95% prediction interval for the mean maximum width of products with the minimum width of 6 cm is (4.716, 7.640).
Want to see more full solutions like this?
Chapter 13 Solutions
Introduction to Statistics and Data Analysis


- After the pandemic hit and people were forced to spend more time indoors, there have been a suspicion among health professionals. that people are eating more and thus gaining weight. In 2018, the average weight of 192 pounds, and health experts want to know if that average weight of the American male has gone up during this pandemic. a. What is the population for which inferencing is being done in this problem? b. What is the population parameter for which inferencing is being done? c. Formulate the hypotheses that can be used by the health expert to confirm their suspisionarrow_forwardA)Test the claim, at the a = 0.10 level of significance, that a linear relation exists between the two variables, for the data below, given that y-1.885x +0.758. -5 |-3| 4 11 6 y Step 1) State the null and alternative hypotheses. Step 2) Determine the critical value for the level of significance, a. Step 3) Find the test statistic or P-value. Step 4) Will the researcher reject the null hypothesis or do not the null hypothesis? Step 5) Write the conclusion. B) The regression line for the given data is v = -1.885x + 0.758. Determine the residual of a data point for which x = 2 and y = -4. SAMSUNG DII 96 &arrow_forward
 Linear Algebra: A Modern IntroductionAlgebraISBN:9781285463247Author:David PoolePublisher:Cengage Learning
 Calculus For The Life SciencesCalculusISBN:9780321964038Author:GREENWELL, Raymond N., RITCHEY, Nathan P., Lial, Margaret L.Publisher:Pearson Addison Wesley,
 Glencoe Algebra 1, Student Edition, 9780079039897...AlgebraISBN:9780079039897Author:CarterPublisher:McGraw Hill
 Big Ideas Math A Bridge To Success Algebra 1: Stu...AlgebraISBN:9781680331141Author:HOUGHTON MIFFLIN HARCOURTPublisher:Houghton Mifflin Harcourt