
Videos
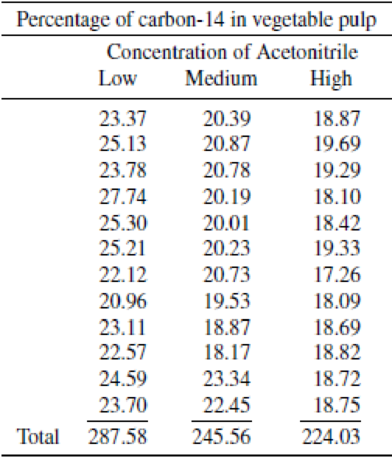
If vegetables intended for human consumption contain any pesticides at all, these pesticides should occur in minute quantities. Detection of pesticides in vegetables sent to market is accomplished by using solvents to extract the pesticides from the vegetables and then performing tests on this extract to isolate and quantify the pesticides present. The extraction process is thought to be adequate because, if known amounts of pesticides are added to “clean” vegetables in a laboratory environment, essentially all the pesticide can be recovered from the artificially contaminated extract.
The following data were obtained from a study by Willis Wheeler and colleagues,4 who sought to determine whether the extraction process is also effective when used in the more realistic situation where pesticides are applied to vegetable crops. Dieldrin (a commonly used pesticide) labeled with (radioactive) carbon-14 was applied to growing radishes. Fourteen days later, the extraction process was used, and the extracts were analyzed for pesticide content. A liquid scintillation counterwas used to determine the amount of carbon-14 present in the extract and also the amount left behind in the vegetable pulp. Because the vegetable pulp typically is discarded when analyzing for pesticides, if an appreciable proportion of pesticide remains in this pulp, a serious underassessment of the amount of pesticide could result. The pesticide was the only source of carbon-14; thus, the proportion of carbon-14 in the pulp is likely to be indicative of the proportion of pesticide in the pulp. The following table shows a portion of the data that the researchers obtained when low, medium, and high concentrations of the solvent, acetonitrile, were used in the extraction process.
a Is there sufficient evidence that the mean percentage of carbon-14 remaining in the vegetable pulp differs for the different concentrations of acetonitrile used in the extraction process? Give bounds for, or use the appropriate applet to determine the attained significance level. What would you conclude at the α = .01 level of significance?
b What assumptions are necessary to validly employ the analysis that you performed in part (a)? Relate the necessary assumptions to the specific application represented in this exercise.

Trending nowThis is a popular solution!

Chapter 13 Solutions
Mathematical Statistics with Applications


- Repeat Example 5 when microphone A receives the sound 4 seconds before microphone B.arrow_forwardSolve Exercise 14 if a 25 solution of the same mixture is added instead of pure alcohol.arrow_forwardAir pollutants common in U.S. cities include fine particulate matter (PM) and ozone (O3). PM is measured as “inhalable” particles 10 micrometers in diameter or “fine inhalable” particles 2.5 micrometers in diameter. Suppose that studies show, for a particular region, that cities exceed PM2.5 standards 20% of the time and exceed ozone standards 10% of the time. Assume that PM2.5 and ozone measurements are statistically independent. A) Determine the probability that a city, selected at random, exceeds one of the standards. B) If a city exceeds the standards, what is the probability that it exceeds only the PM2.5 standard?arrow_forward
- The DENR has a new procedure to detect algal bloom in water being tested. This new procedure is important because, it could be used to detect three different contaminants-organic pollutants, volatile solvents, and chlorinated compounds. The department claims that it can detect high levels of organic pollutants with 99.95% accuracy, volatile solvents with 89.70% accuracy, and chlorinated compounds with 99.70% accuracy. If an algal bloom is not present, the test does not signal. Samples are prepared for the calibration of the test and 60% of them are contaminated with organic pollutants, 27% with volatile solvents, and 13% with traces of chlorinated compounds. A test sample is selected randomly. Denote as follows: S = signal, O = organic pollutants, V = volatile solvents, C = chlorinated compounds. If the test signals, what is the probability that chlorinated compounds are present? (Show complete solution in your answer sheet) O a. P(CIS) = 0.1386 Ob.P(C|S) = 0.1184 OC. None among the…arrow_forwardA new analytical method to detect pollutants in water is being tested. This new method of chemical analysis is important because, if adopted, it could be used to detect three different contaminates - organic pollutants, volatile solvents, and chlorinated compounds - instead of having to use a single test for each pollutant. The makers of the test claim that it can detect high levels of organic pollutants with 99.6% accuracy, volatile solvents with 99.91% accuracy, and chlorinated compounds with 89.4% accuracy. If a pollutant is not present, the test does not signal. Samples are prepared for the calibration of the test and 60% of them are contaminated with organic pollutants, 27% with volatile solvents, and 13% with traces of chlorinated compounds. A test sample is selected randomly. (a) What is the probability that the test will signal? (b) If the test signals, what is the probability that the chlorinated compounds are present? Carry out all calculations exactly, then round the final…arrow_forwardAssume that a population of patients contains 30% of individuals who suffer from a certain fatal syndrome Z, which simultaneously makes it uncomfortable for them to take a life-prolonging drug X. Let Z = 1 and Z = 0 represent, respectively, the presence and absence of the syndrome, Y = 1 and Y = 0 represent death and survival, respectively, and X = 1 and X = 0 represent taking and not taking the drug. Assume that patients not carrying the syndrome, Z = 0, die with probability 0.5 if they take the drug and with probability 0.5 if they do not. Patients carrying the syndrome, Z = 1, on the other hand, die with probability 0.7 if they do not take the drug and with probability 0.3 if they do take the drug. Further, patients having the syndrome are more likely to avoid the drug, with probabilities p(X = 1|Z=0) = 0.9 and P(X = 1|Z = 1) = 0.6 . Based on this model, compute the joint distributions and for all values of x, y, and z. Present the following joint distributions in tables. [Hint:…arrow_forward
- The DENR has a new procedure to detect algal bloom in water being tested. This new procedure is important because, it could be used to detect three different contaminants-organic pollutants, volatile solvents, and chlorinated compounds. The department claims that it can detect high levels of organic pollutants with 99.95% accuracy, volatile solvents with 99.70% accuracy, and chlorinated compounds with 89.70% accuracy. If an algal bloom is not present, the test does not signal. Samples are prepared for the calibration of the test and 60% of them are contaminated with organic pollutants, 27% with volatile solvents, and 13% with traces of chlorinated compounds. A test sample is selected randomly. Denote as follows: S= signal, 0 = organic pollutants, V = volatile solvents, C = chlorinated compounds. If the test signals, what is the probability that chlorinated compounds are present? (Show complete solution in your answer sheet) O a. P(C|S) = 0.1184 O b. P(C|S) = 0.1386 O c. None among the…arrow_forwardEnvironmental conditions can affect the growth of coral. To study this, a researcher examined a species of coral that is found in the Caribbean Sea and the Gulf of Mexico. At 12 localities, he determined the average annual calcification rate of coral over a period of several years and the average annual maximum sea surface temperature during the same period. Calcification rate affects the growth of coral, with higher rates corresponding to greater growth. The table contains data for these 12 localities. Maximum sea surface temperature (°C) and calcification rate (g cm² yr¯¹) Maximum Sea Surface Temperature 29.4 29.4 29.4 29.6 29.1 28.7 Calcification Rate 1.48 1.53 1.52 1.48 1.31 1.25 Maximum Sea Surface Temperature 29.7 29.5 29.4 29.0 29.0 29.0 Calcification Rate 1.63 1.53 1.46 1.24 1.29 1.12 To access the complete data set, click the link for your preferred software format: Excel Minitab JMP SPSS TI R Mac-TXT PC-TXT CSV CrunchIt! The residuals for average annual maximum sea surface…arrow_forwardAs humans we consume food. The body extracts good things such as proteins and vitamins and throws away waste. A typical waste product is uric acid. High levels of uric acid can be an indication of conditions such as gout, kidney disease, and cancer. For females a high level of uric acid is 6 mg/dL or more and for males a high level of uric acid is 7 mg/dL or more. Suppose, over a period of months, an adult male was given 9 blood tests for uric acid. The results of each blood test are shown below. results 10.24 10.1 11.19 11.1 9.34 9.58 9.63 10.59 9.58 The distribution of uric acid in healthy adult males is normally distributed with known population standard deviation, σ=1.15σ=1.15 mg/dl.Find a 95% confidence interval for the population mean of uric acid in this adult male's blood. Assume the sample of blood tests were given in a way that's equivalent to a simple random sample. (Round your answers to two decimal places.) margin of error ? mg/dLlower limit? mg/dLupper limit?…arrow_forward
- As humans we consume food. The body extracts good things such as proteins and vitamins and throws away waste. A typical waste product is uric acid. High levels of uric acid can be an indication of conditions such as gout, kidney disease, and cancer. For females a high level of uric acid is 6 mg/dL or more and for males a high level of uric acid is 7 mg/dL or more. Suppose, over a period of months, an adult male has taken 8 blood test for uric acid. The results of the test are shown below. results 1.54 7.96 7.51 4.84 1.87 6.53 5.99 5.03 The distribution of uric acid in healthy adult males is normally distributed.Find a 95% confidence interval for the population mean of uric acid in this adult male's blood. (Round your answers to two decimal places.)margin of error mg/dL lower limit mg/dL upper limit mg/dLDoes this confidence interval suggest that this adult male has a high level of uric acid? No, since the interval is contained within the acceptable range levels. Yes, since the…arrow_forwardAs humans we consume food. The body extracts good things such as proteins and vitamins and throws away waste. A typical waste product is uric acid. High levels of uric acid can be an indication of conditions such as gout, kidney disease, and cancer. For females a high level of uric acid is 6 mg/dL or more and for males a high level of uric acid is 7 mg/dL or more. Suppose, over a period of months, an adult female was given 5 blood tests for uric acid. The results of each blood test are shown below. results 6.75 6.68 12.07 10.29 6.68 The distribution of uric acid in healthy adult females is normally distributed with known population standard deviation, σ=2.09σ=2.09 mg/dl.Find a 95% confidence interval for the population mean of uric acid in this adult female's blood. Assume the sample of blood tests were given in a way that's equivalent to a simple random sample. (Round your answers to two decimal places.)margin of error mg/dLlower limit mg/dLupper limit mg/dLDoes this…arrow_forwardAs humans we consume food. The body extracts good things such as proteins and vitamins and throws away waste. A typical waste product is uric acid. High levels of uric acid can be an indication of conditions such as gout, kidney disease, and cancer. For females a high level of uric acid is 6 mg/dL or more and for males a high level of uric acid is 7 mg/dL or more. Suppose, over a period of months, an adult female was given 10 blood tests for uric acid. The results of each blood test are shown below. Pisces for Tutoring BVC Student esources results 2.52 4.15 5.91 7.55 7.77 5.4 4.37 3.22 3.48 3.13 hat pogle Drive The distribution of uric acid in healthy adult females is normally distributed with known population standard deviation, o = 2.15 mg/dl. Find a 95% confidence interval for the population mean of uric acid in this adult female's blood. Assume the sample of blood tests were given in a way that's equivalent to a simple random sample. (Round your answers to two decimal places.)…arrow_forward
 Trigonometry (MindTap Course List)TrigonometryISBN:9781337278461Author:Ron LarsonPublisher:Cengage Learning
 Calculus For The Life SciencesCalculusISBN:9780321964038Author:GREENWELL, Raymond N., RITCHEY, Nathan P., Lial, Margaret L.Publisher:Pearson Addison Wesley,